This training guide will help you master the Kynection Aware Module, allowing
you to view and manage the visibility of all your GPS and AI camera devices.
1. Open Map View
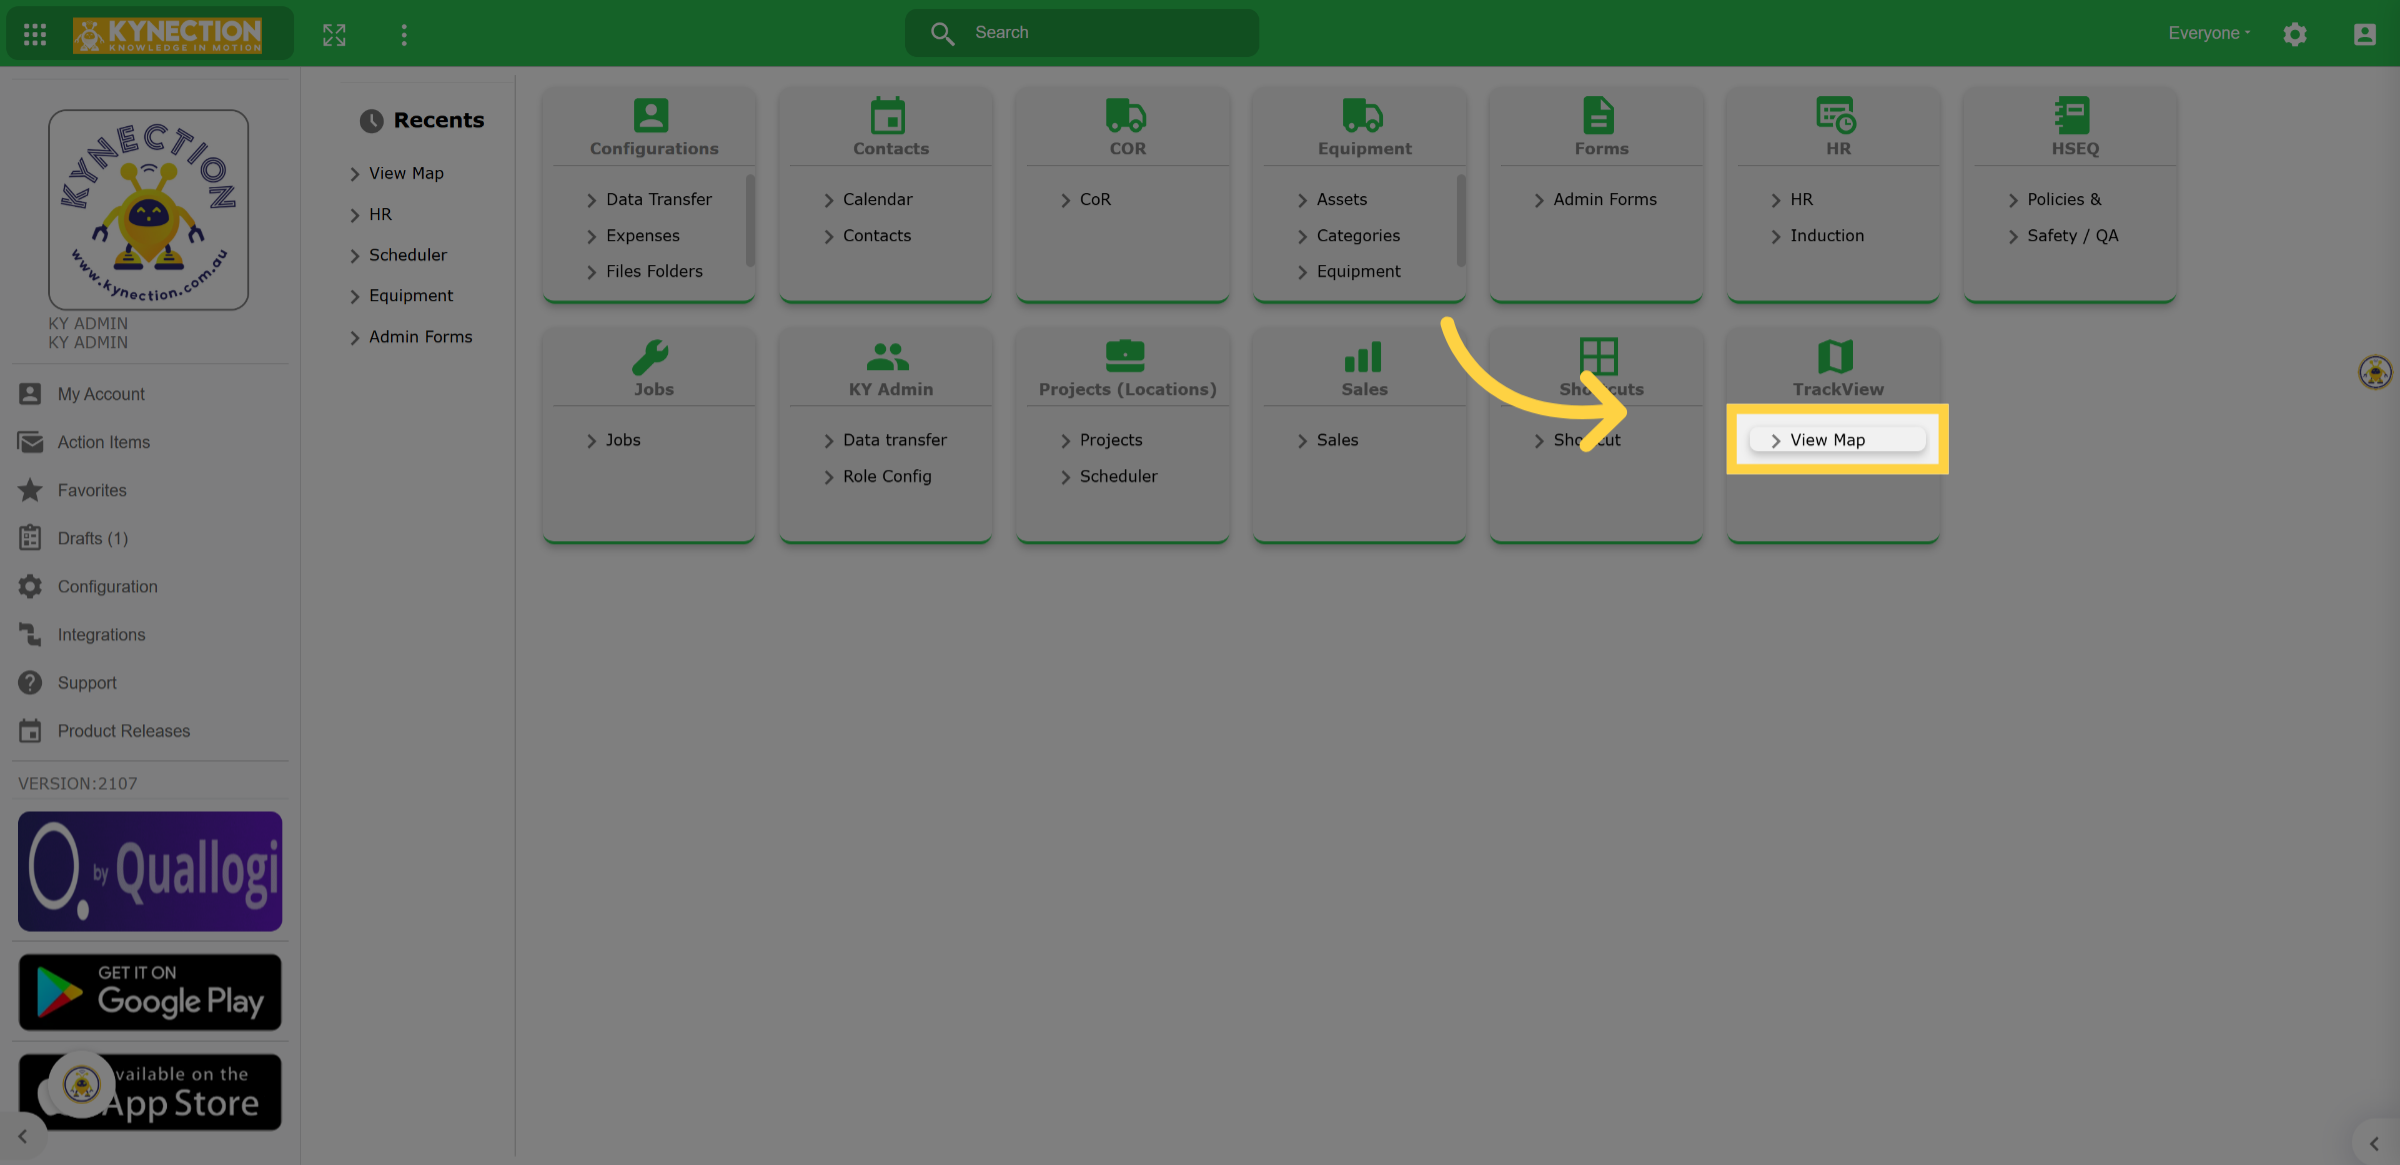
On the home dashboard, locate the Trackview or Award module, then select View Map.
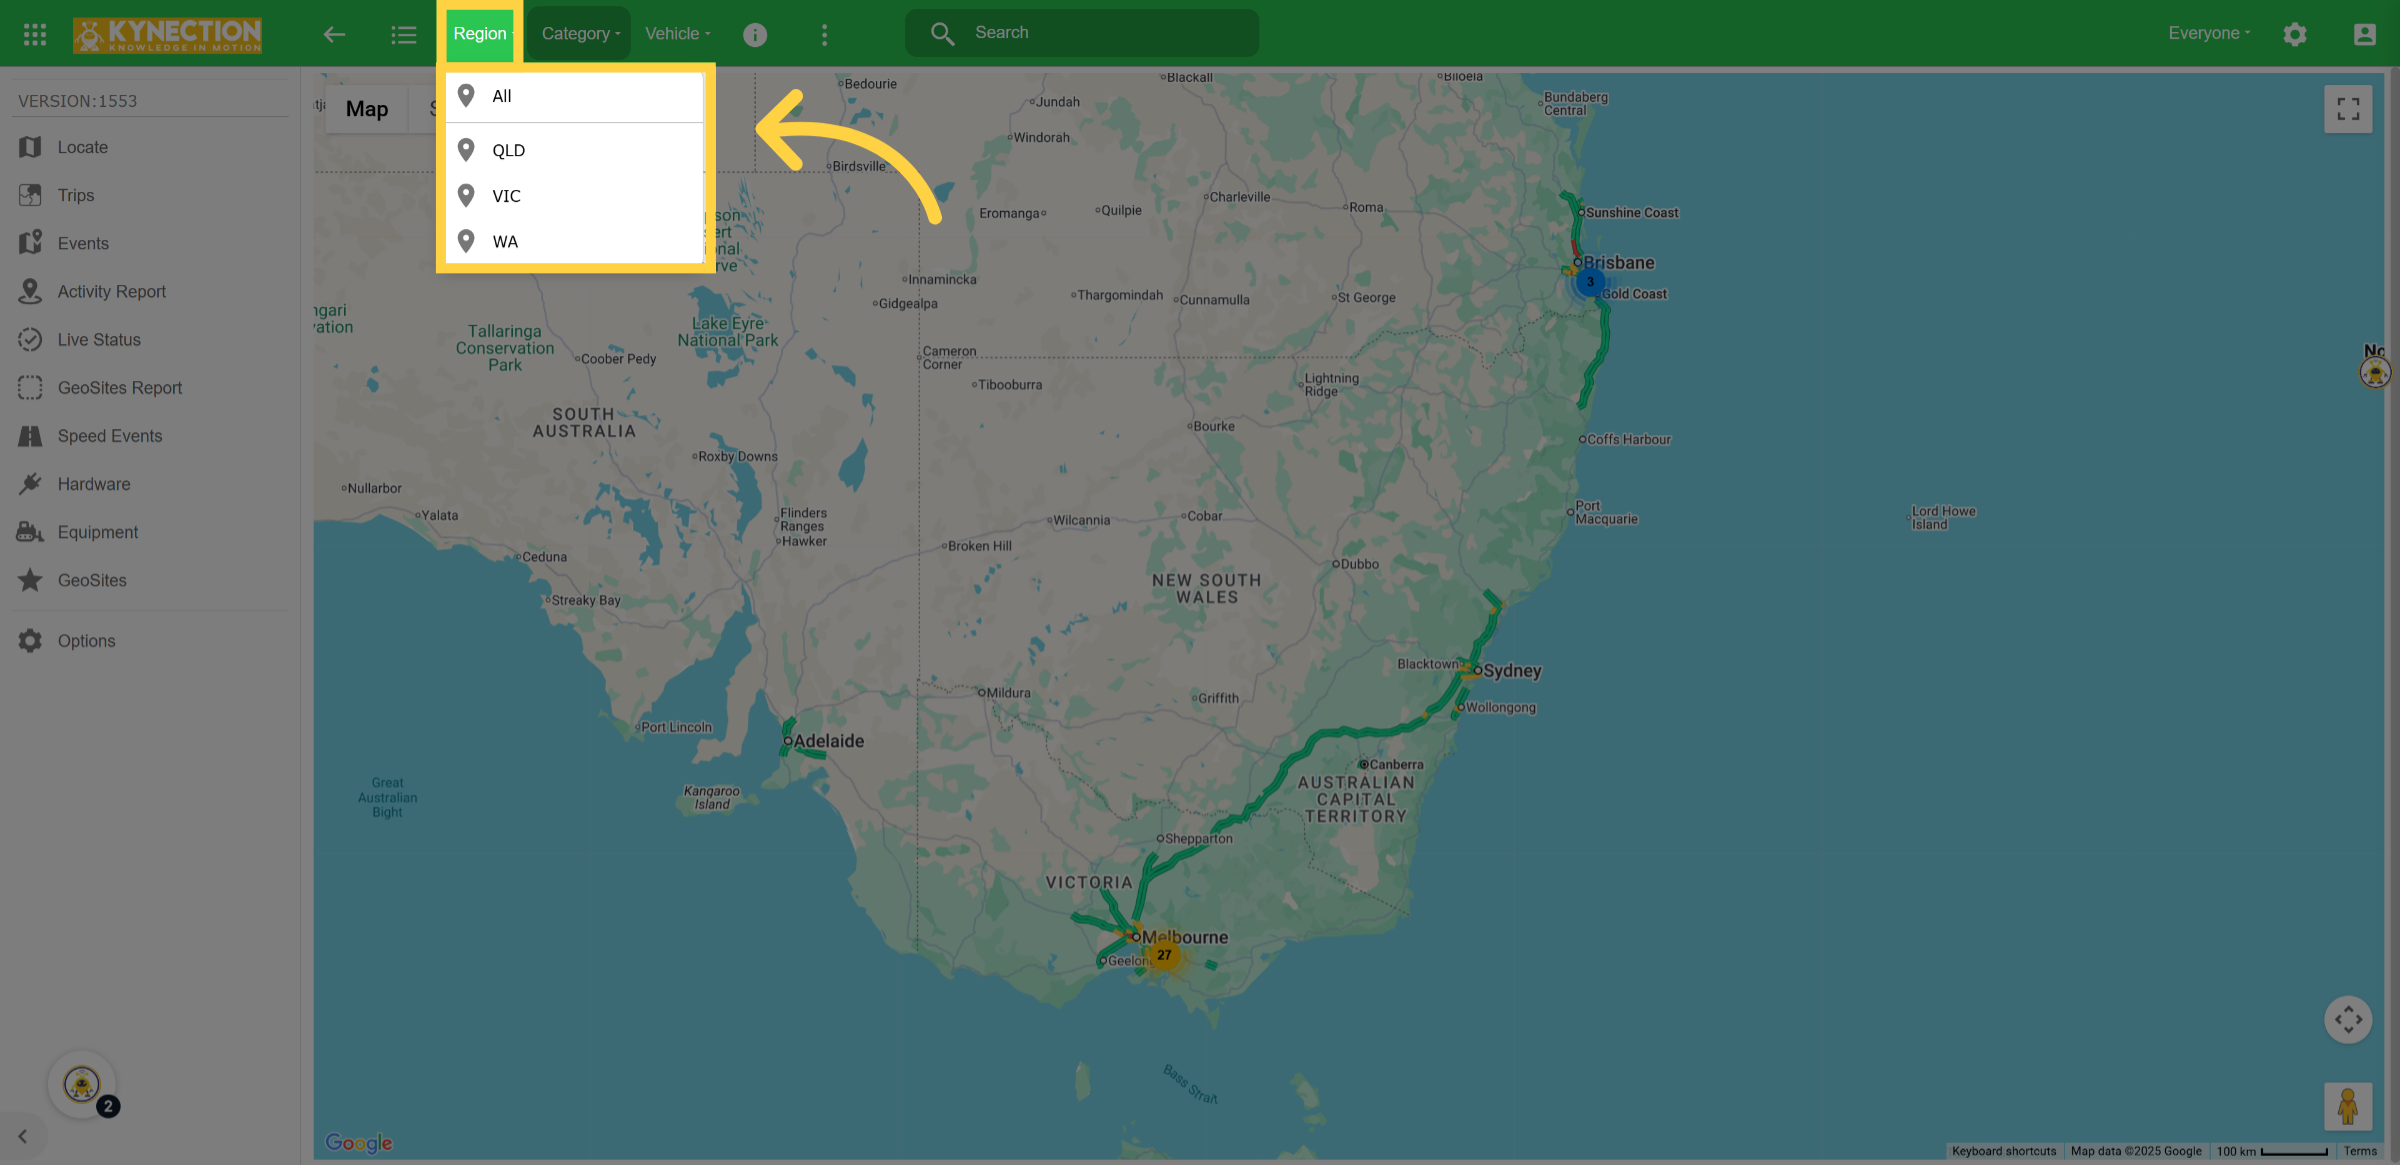
2. Region Filter
Utilize the region filter to sort your assets by region.
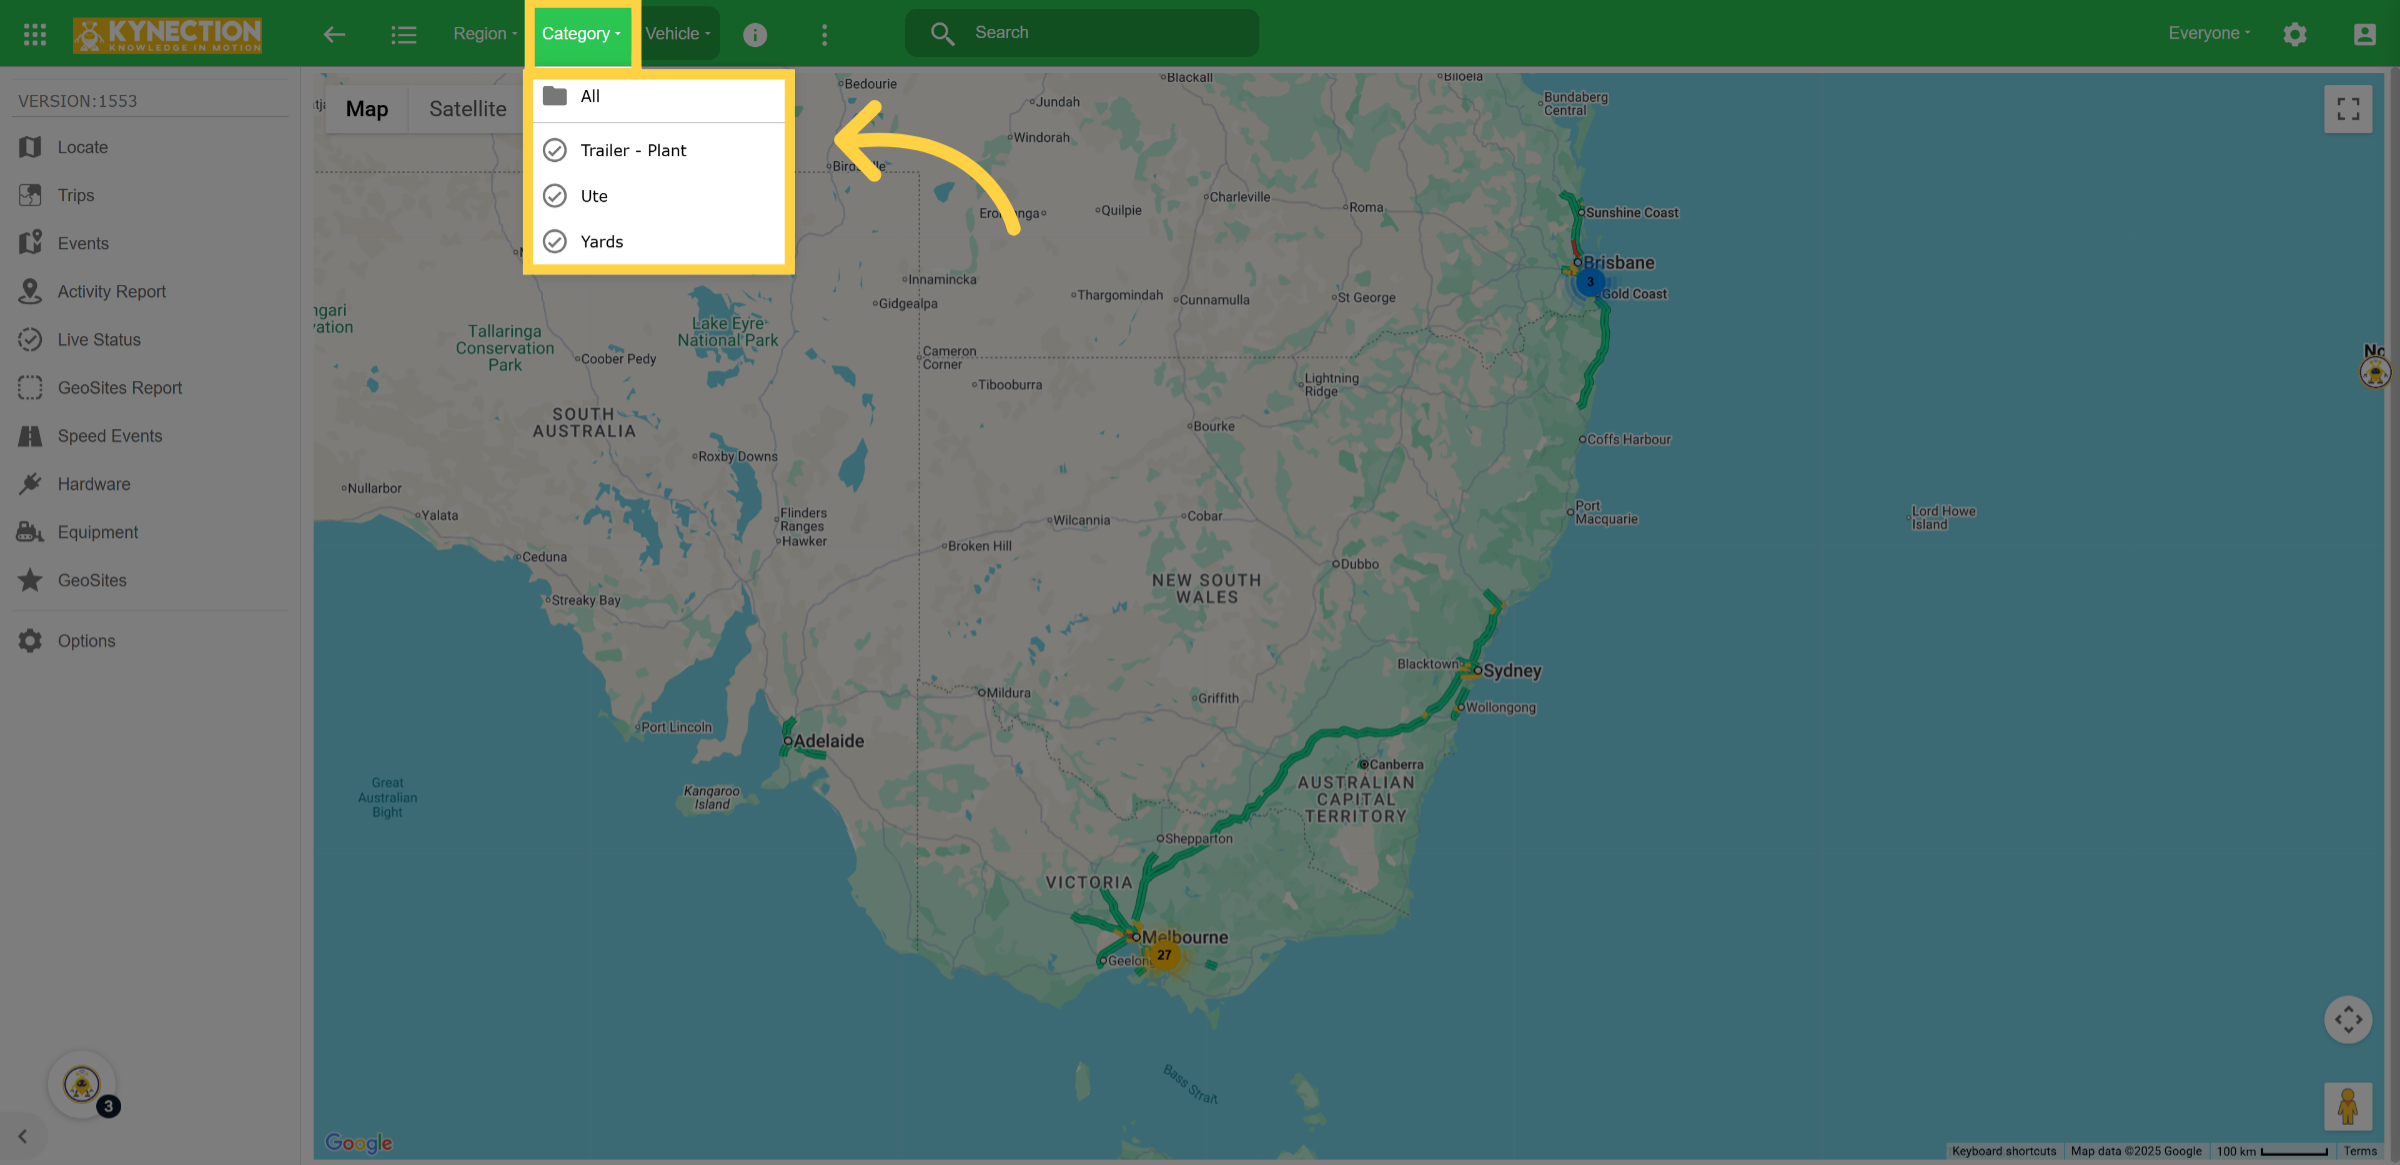
3. Category Filter
Use the Category filter to organize your asset categories.
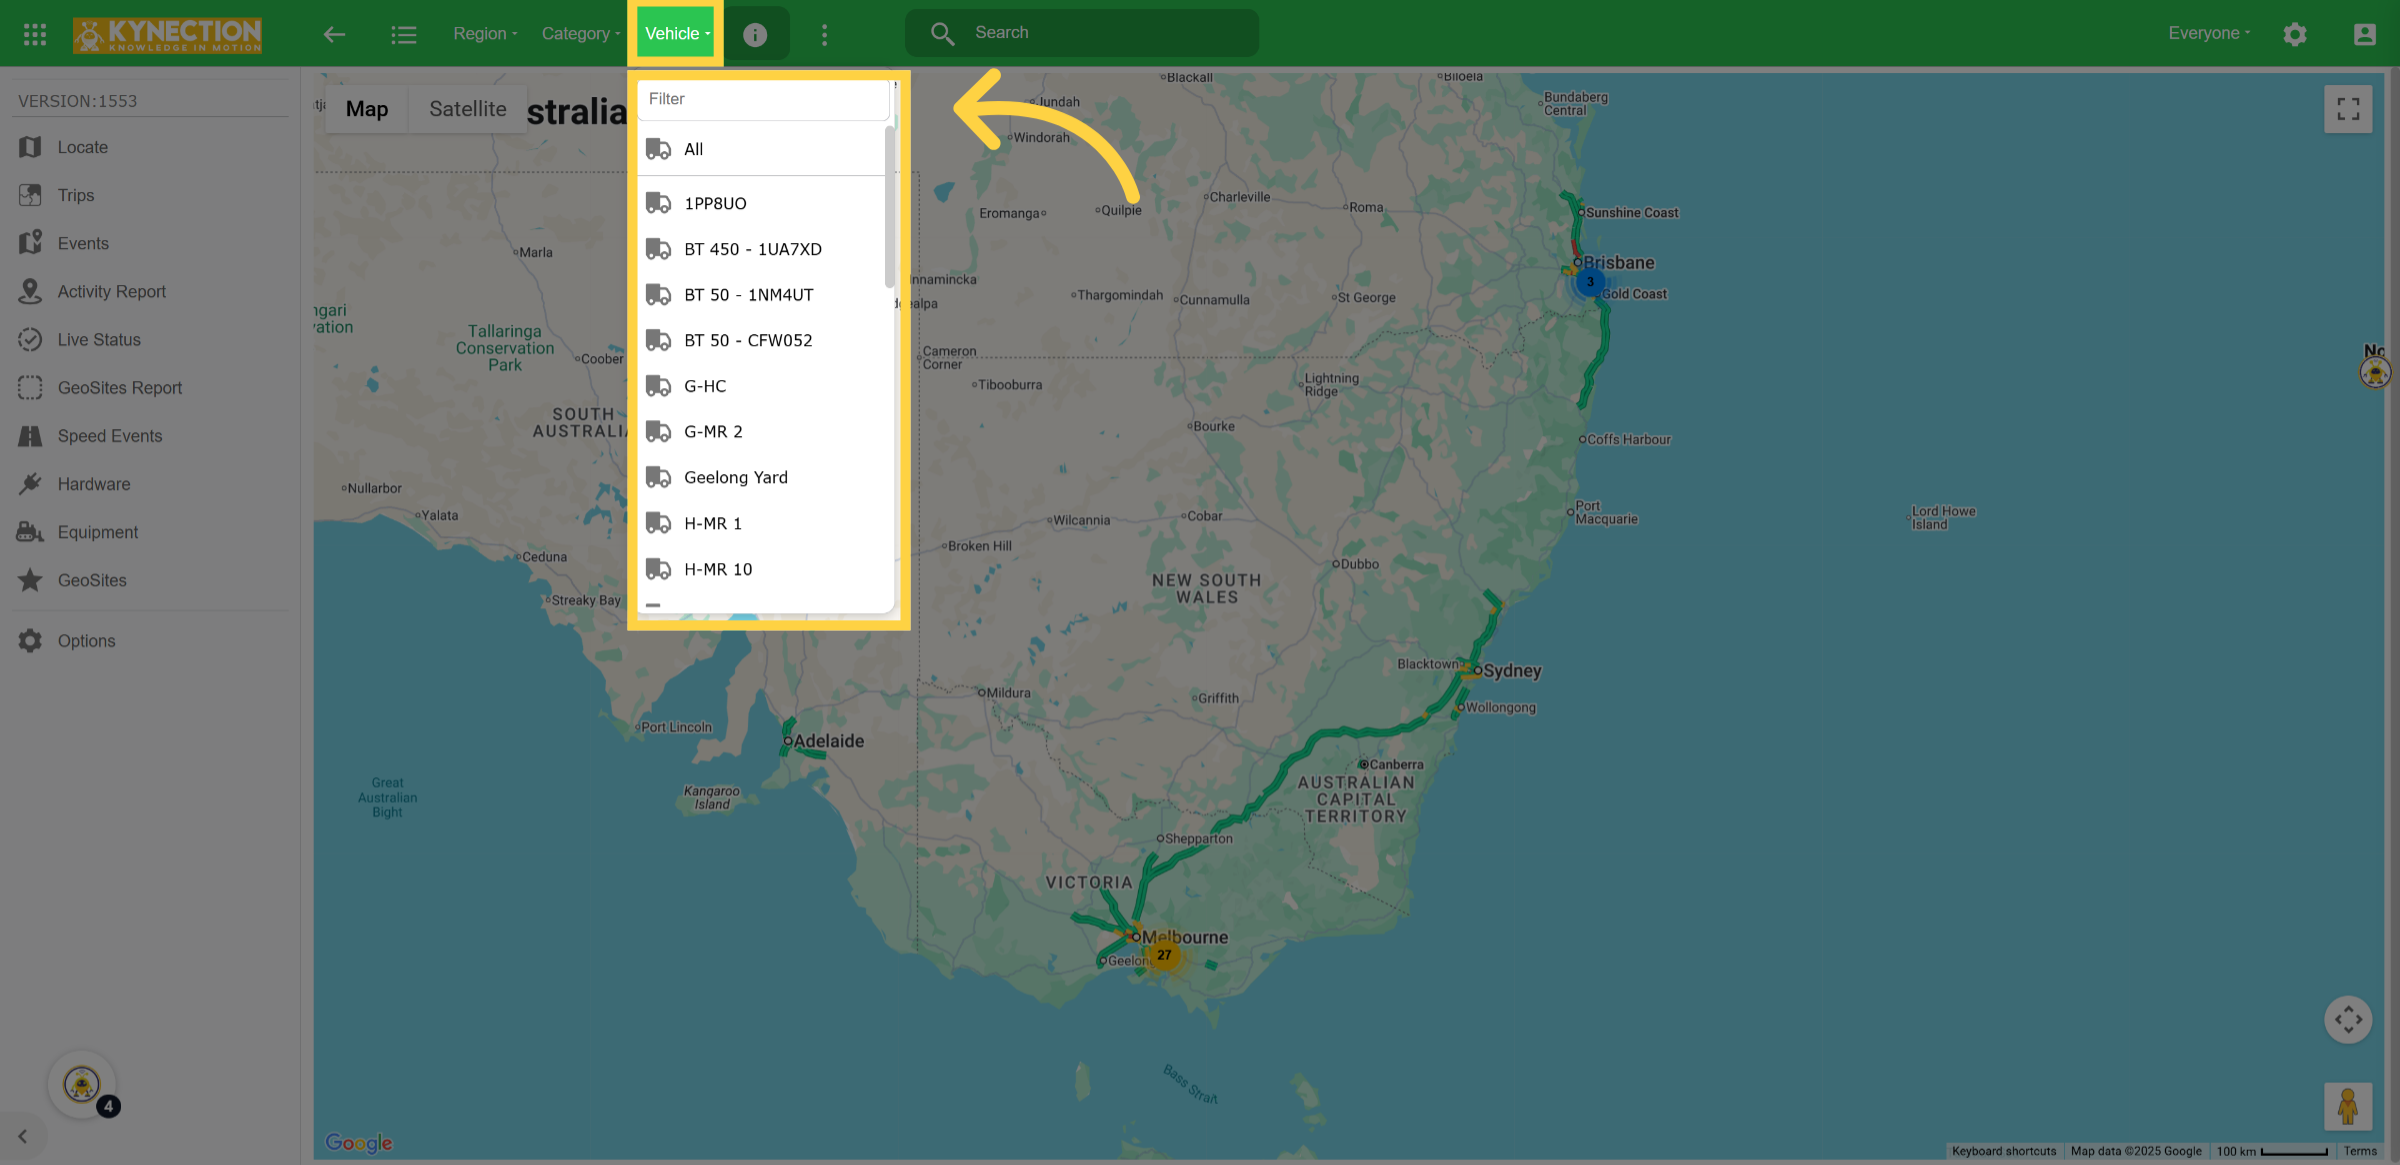
4. Vehicles
Utilize the vehicle filter to locate a specific asset.
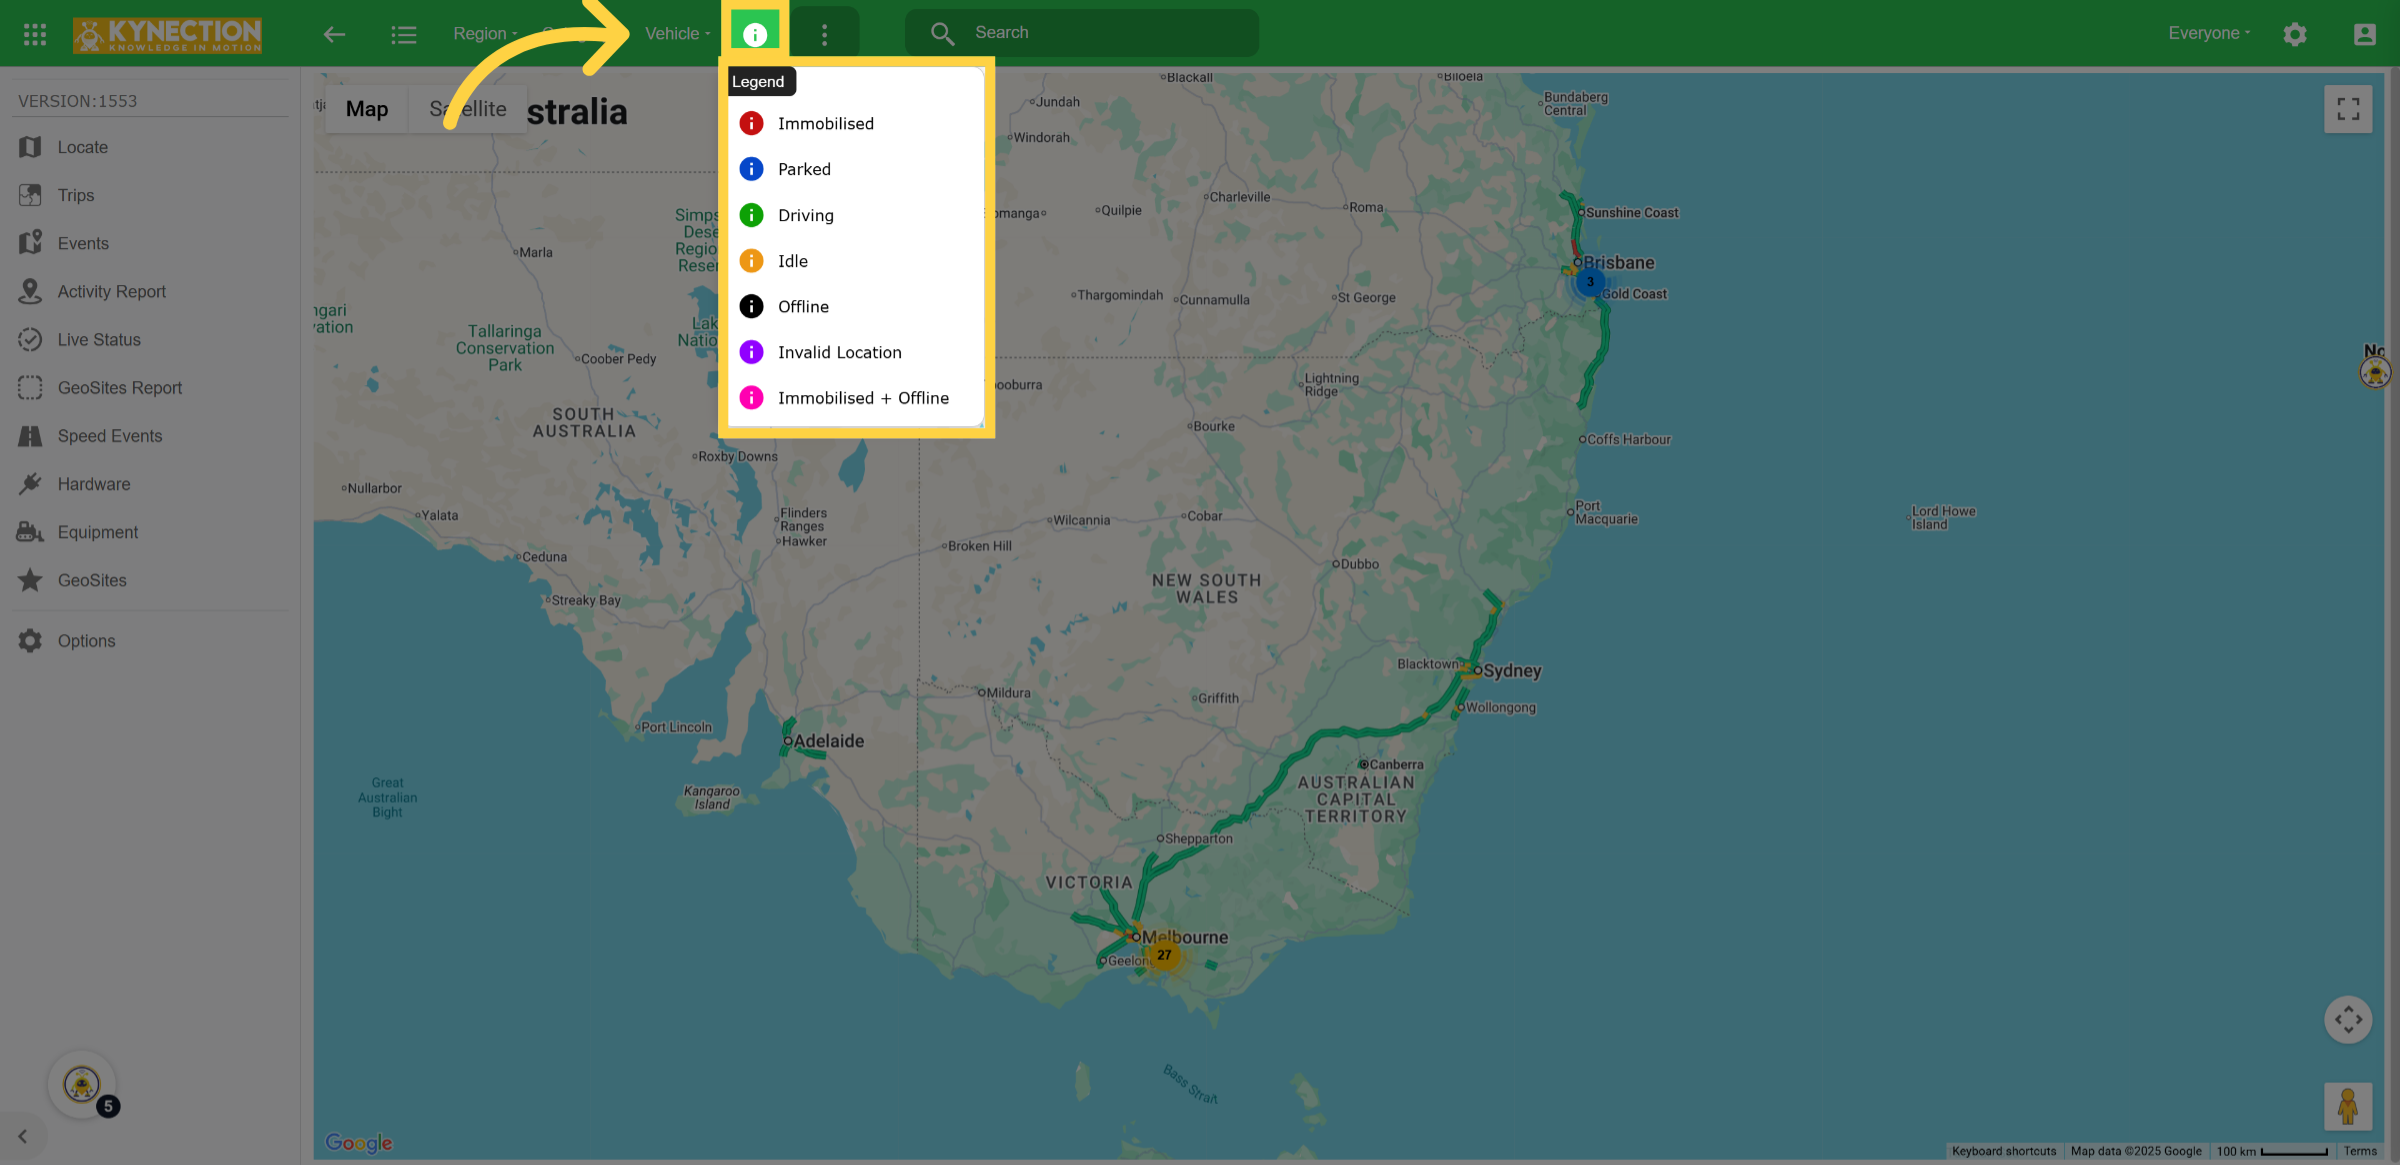
5. Information Icon
The information icon, when clicked, will display a color legend that clearly indicates the current status of the vehicle.
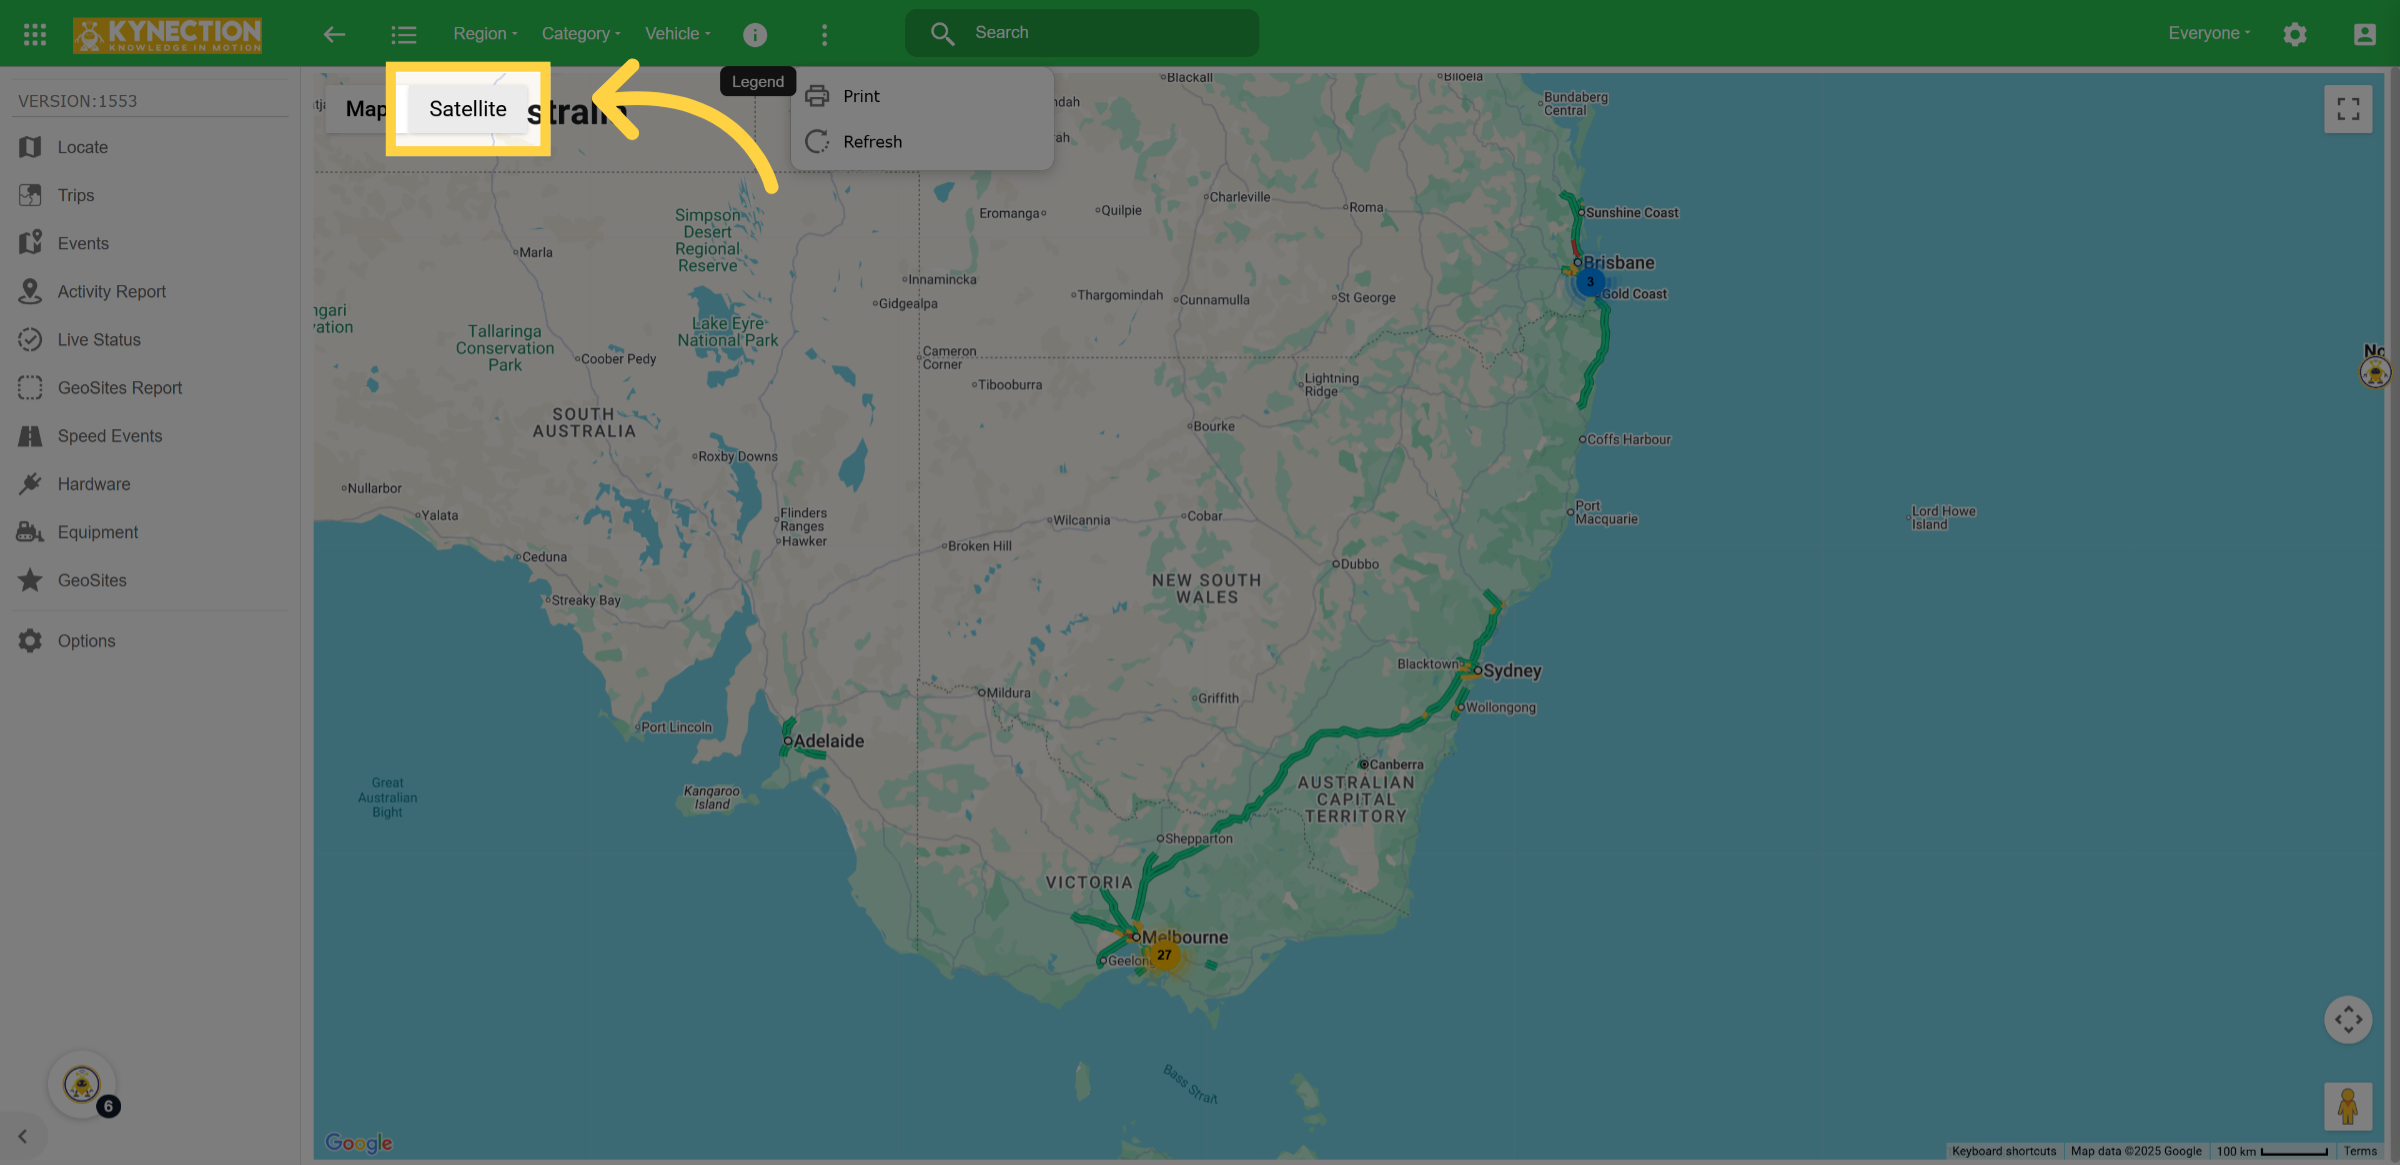
6. Enable Satellite View
To activate satellite mode and enhance detail, select the Show Satellite Imagery option on the map.
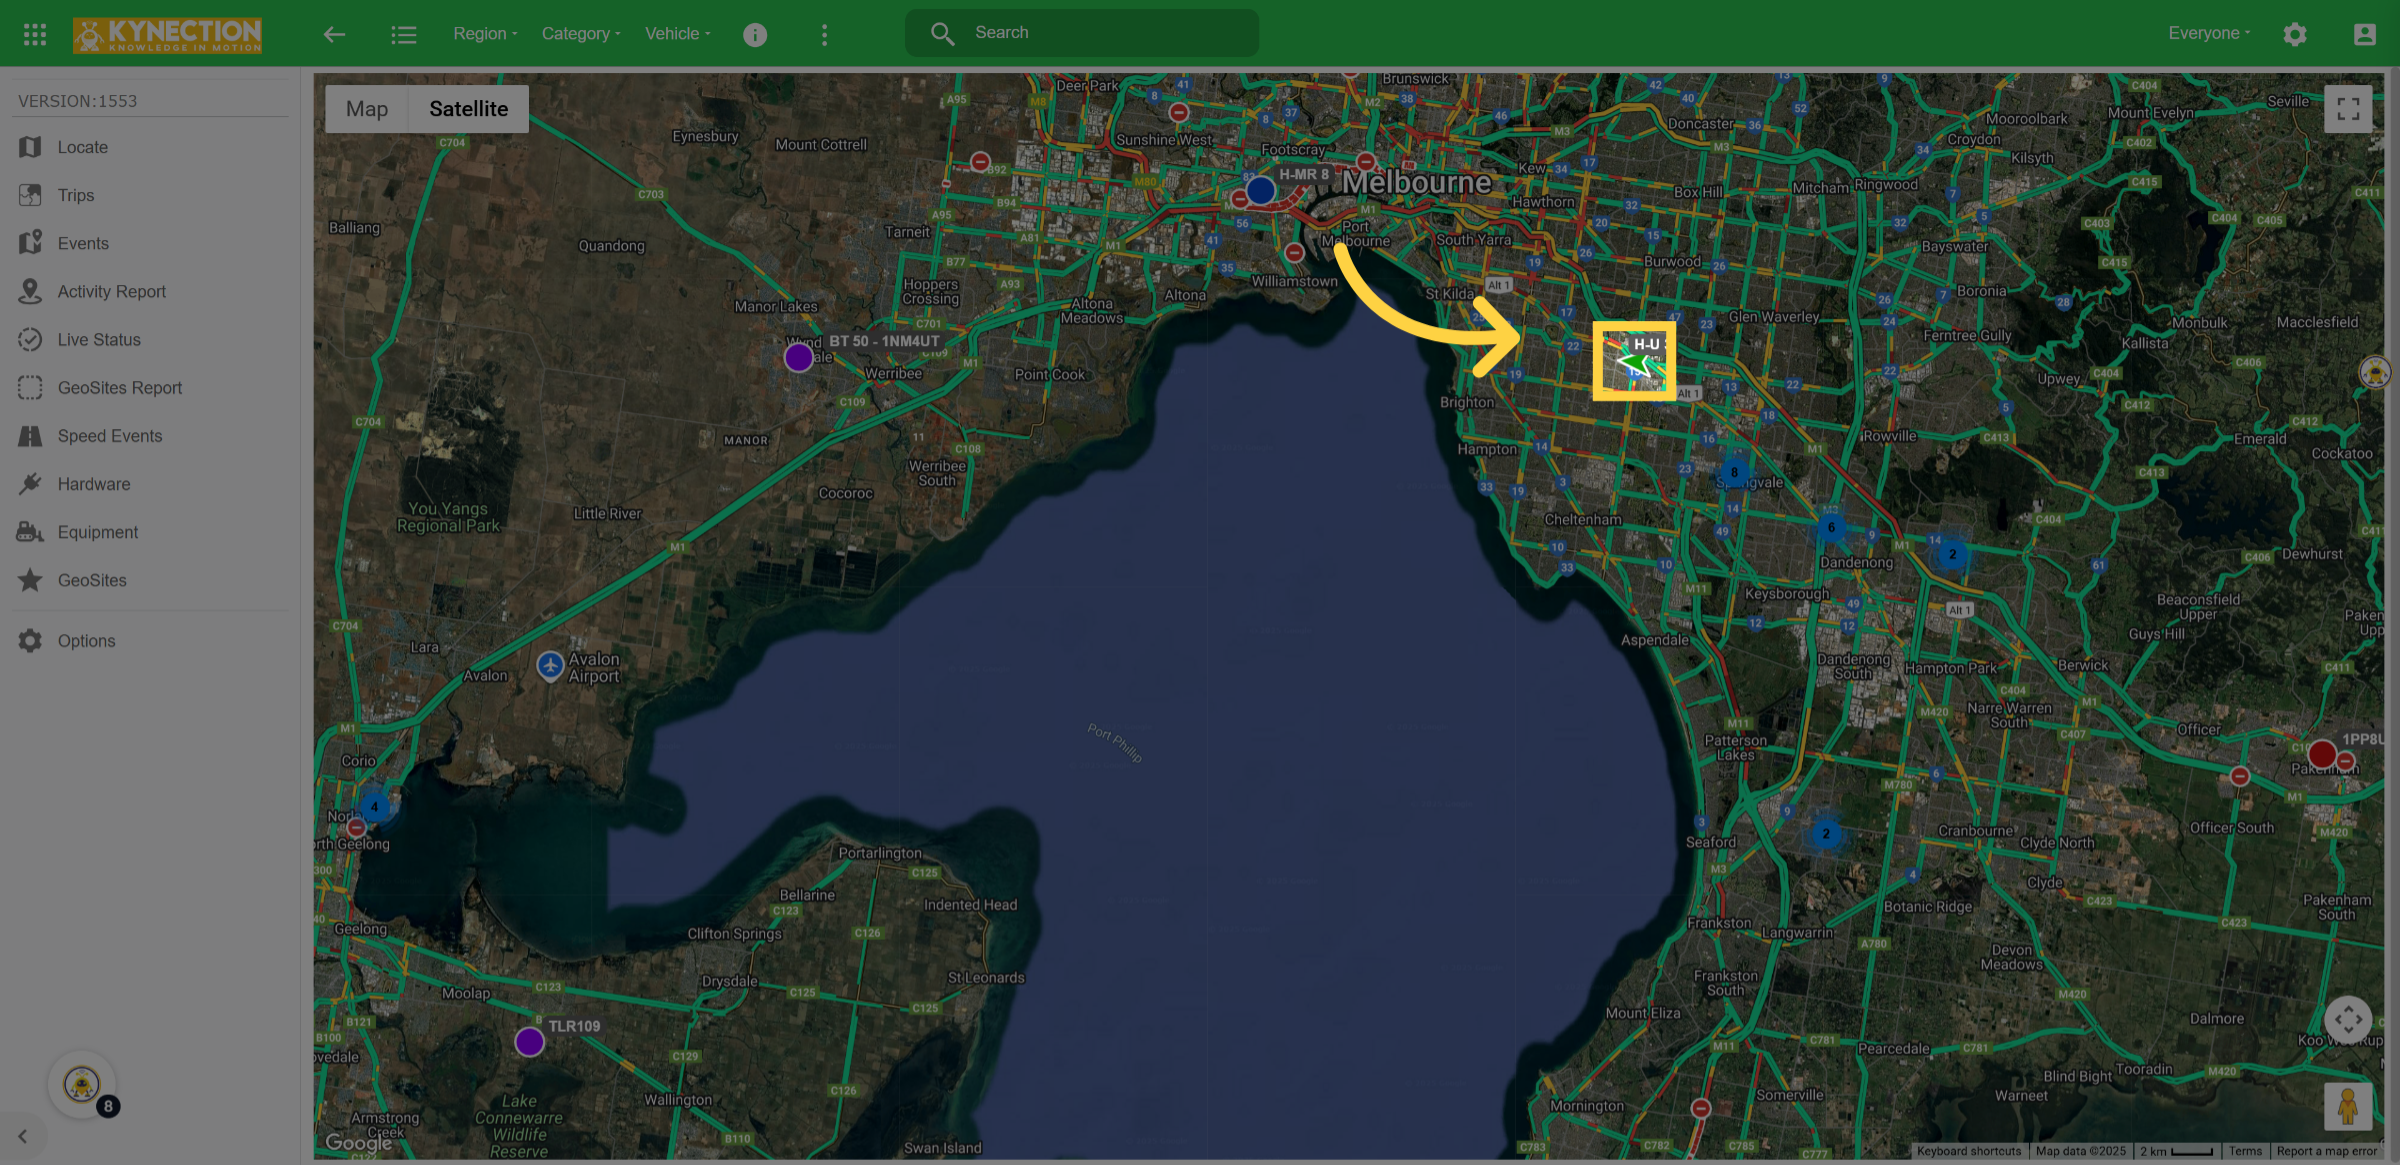
7. Assets
On the live map, you can view all your GPS-equipped assets, including Kynection hardware and third-party devices such as Geotab, Hitachi, and Caterpillar. For instance, let's select a vehicle to explore its details further.
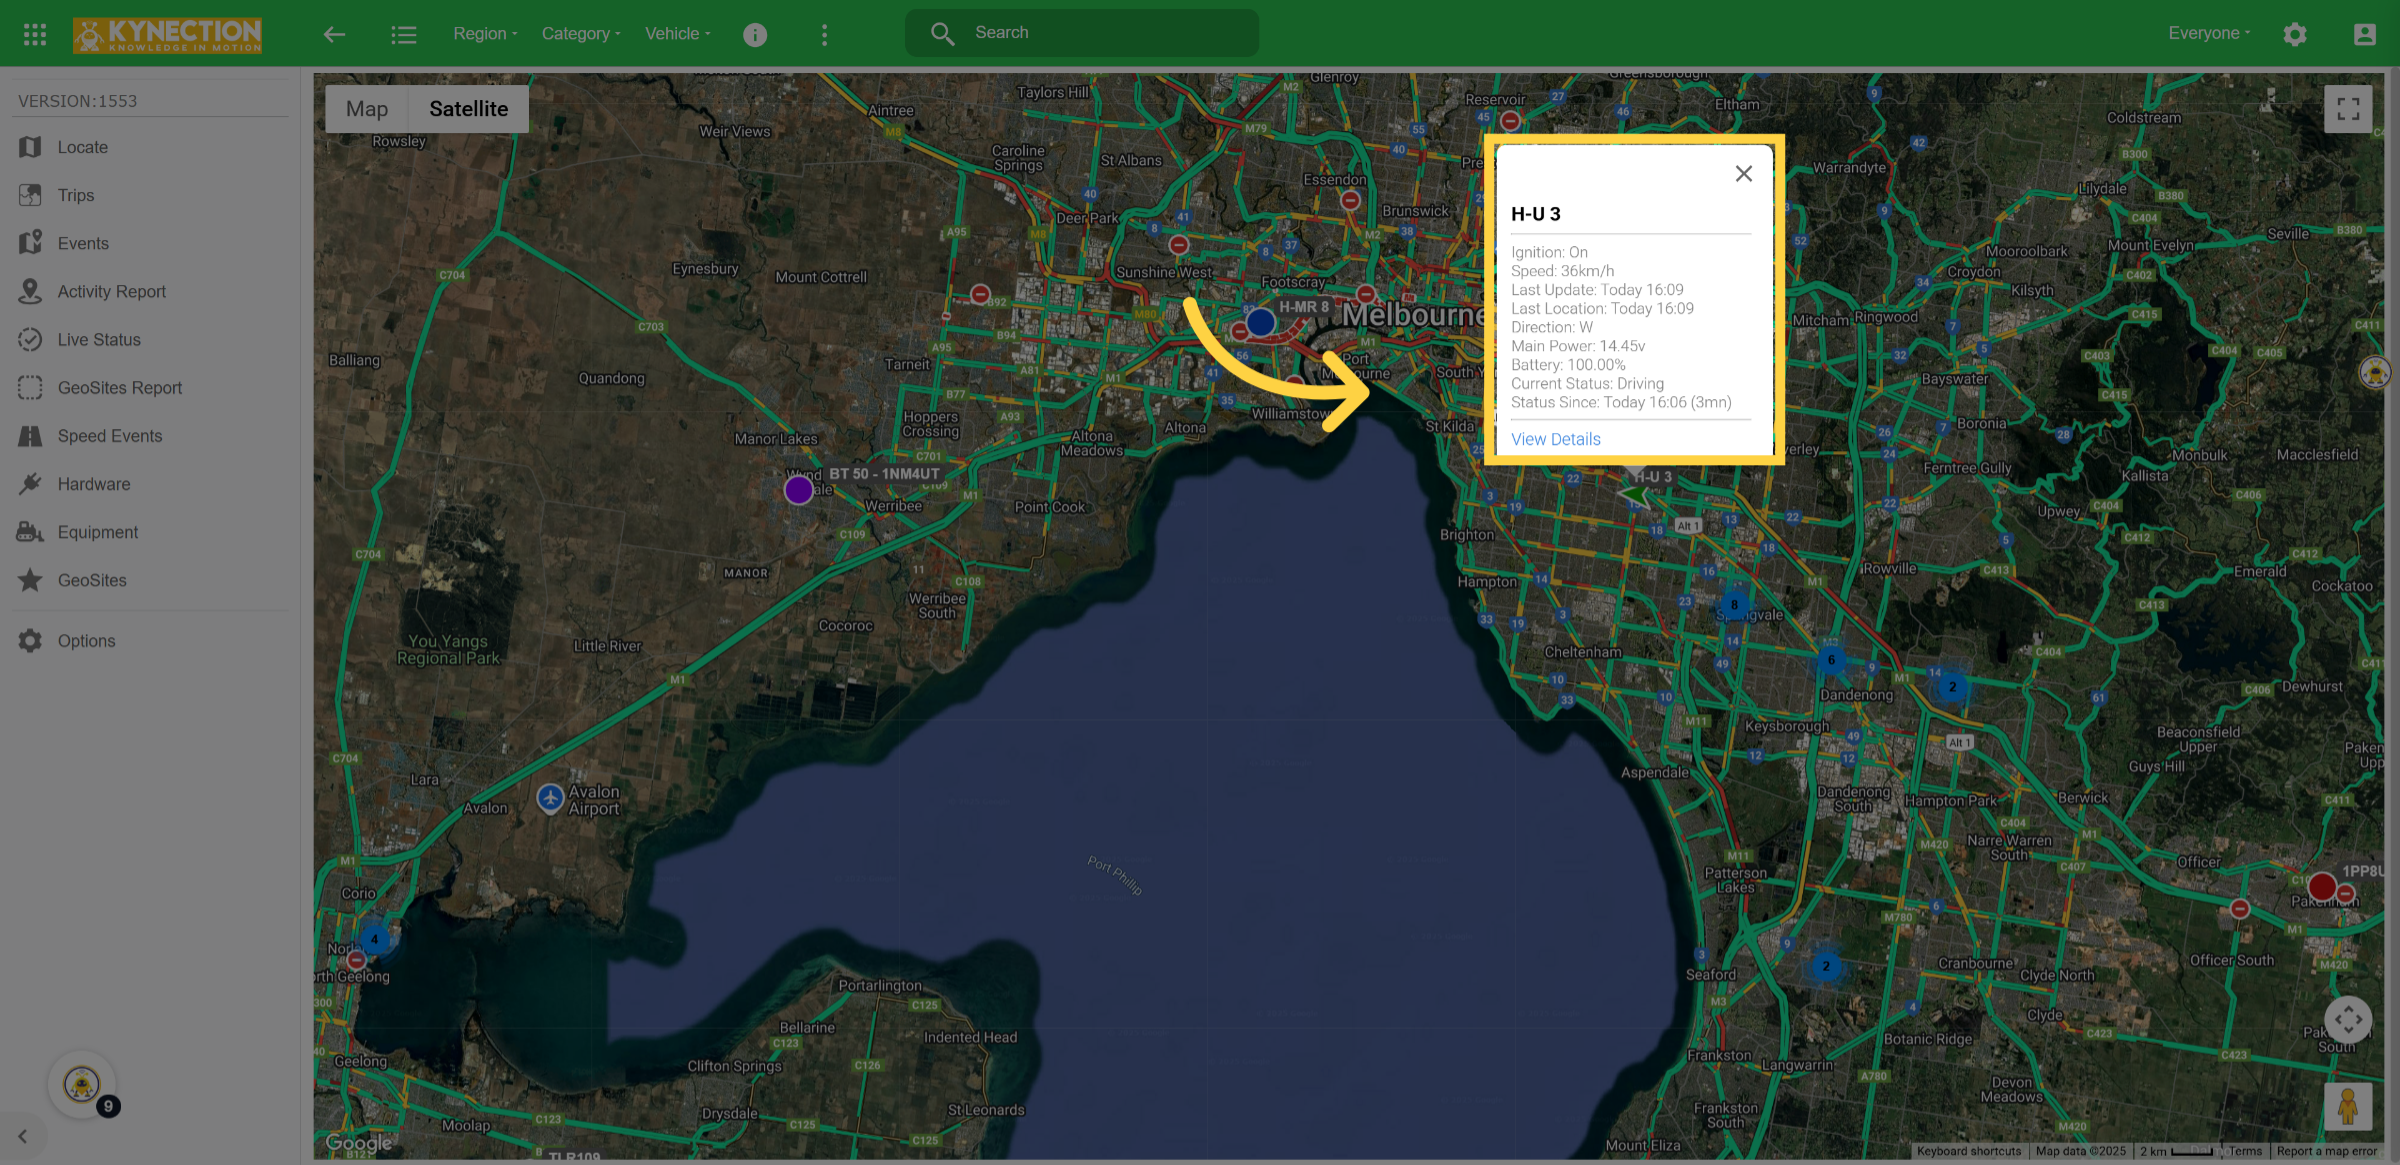
8. View Vehicle Details
Access detailed information about the selected vehicle's status and history by viewing its details.
9. Trips tab
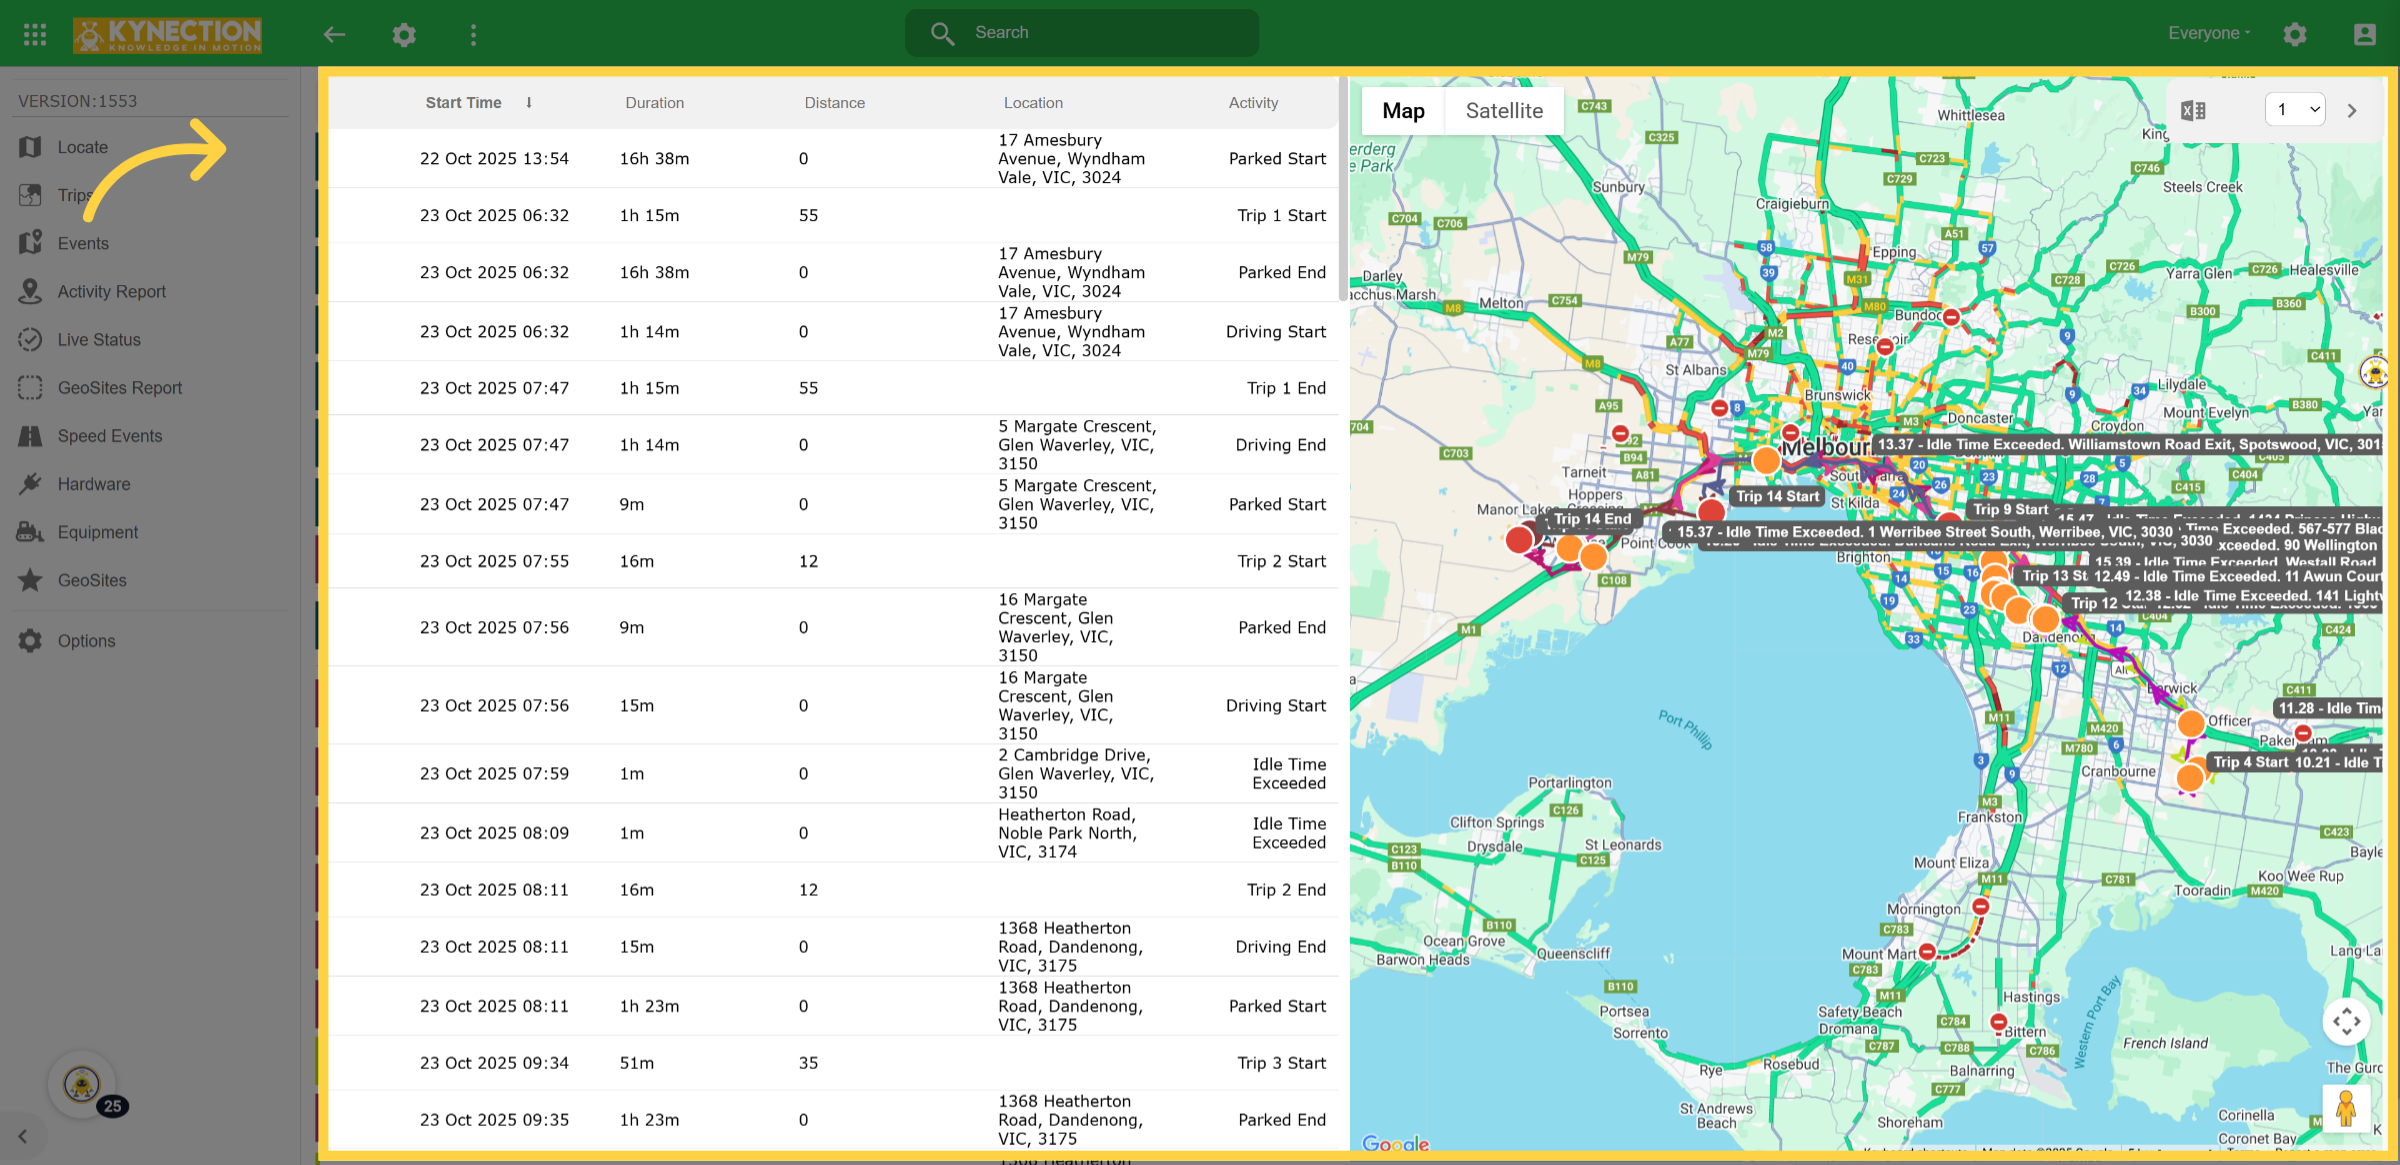
The Trips tab offers comprehensive details about each vehicle journey, including start and end times, duration, locations, and the total number of events.
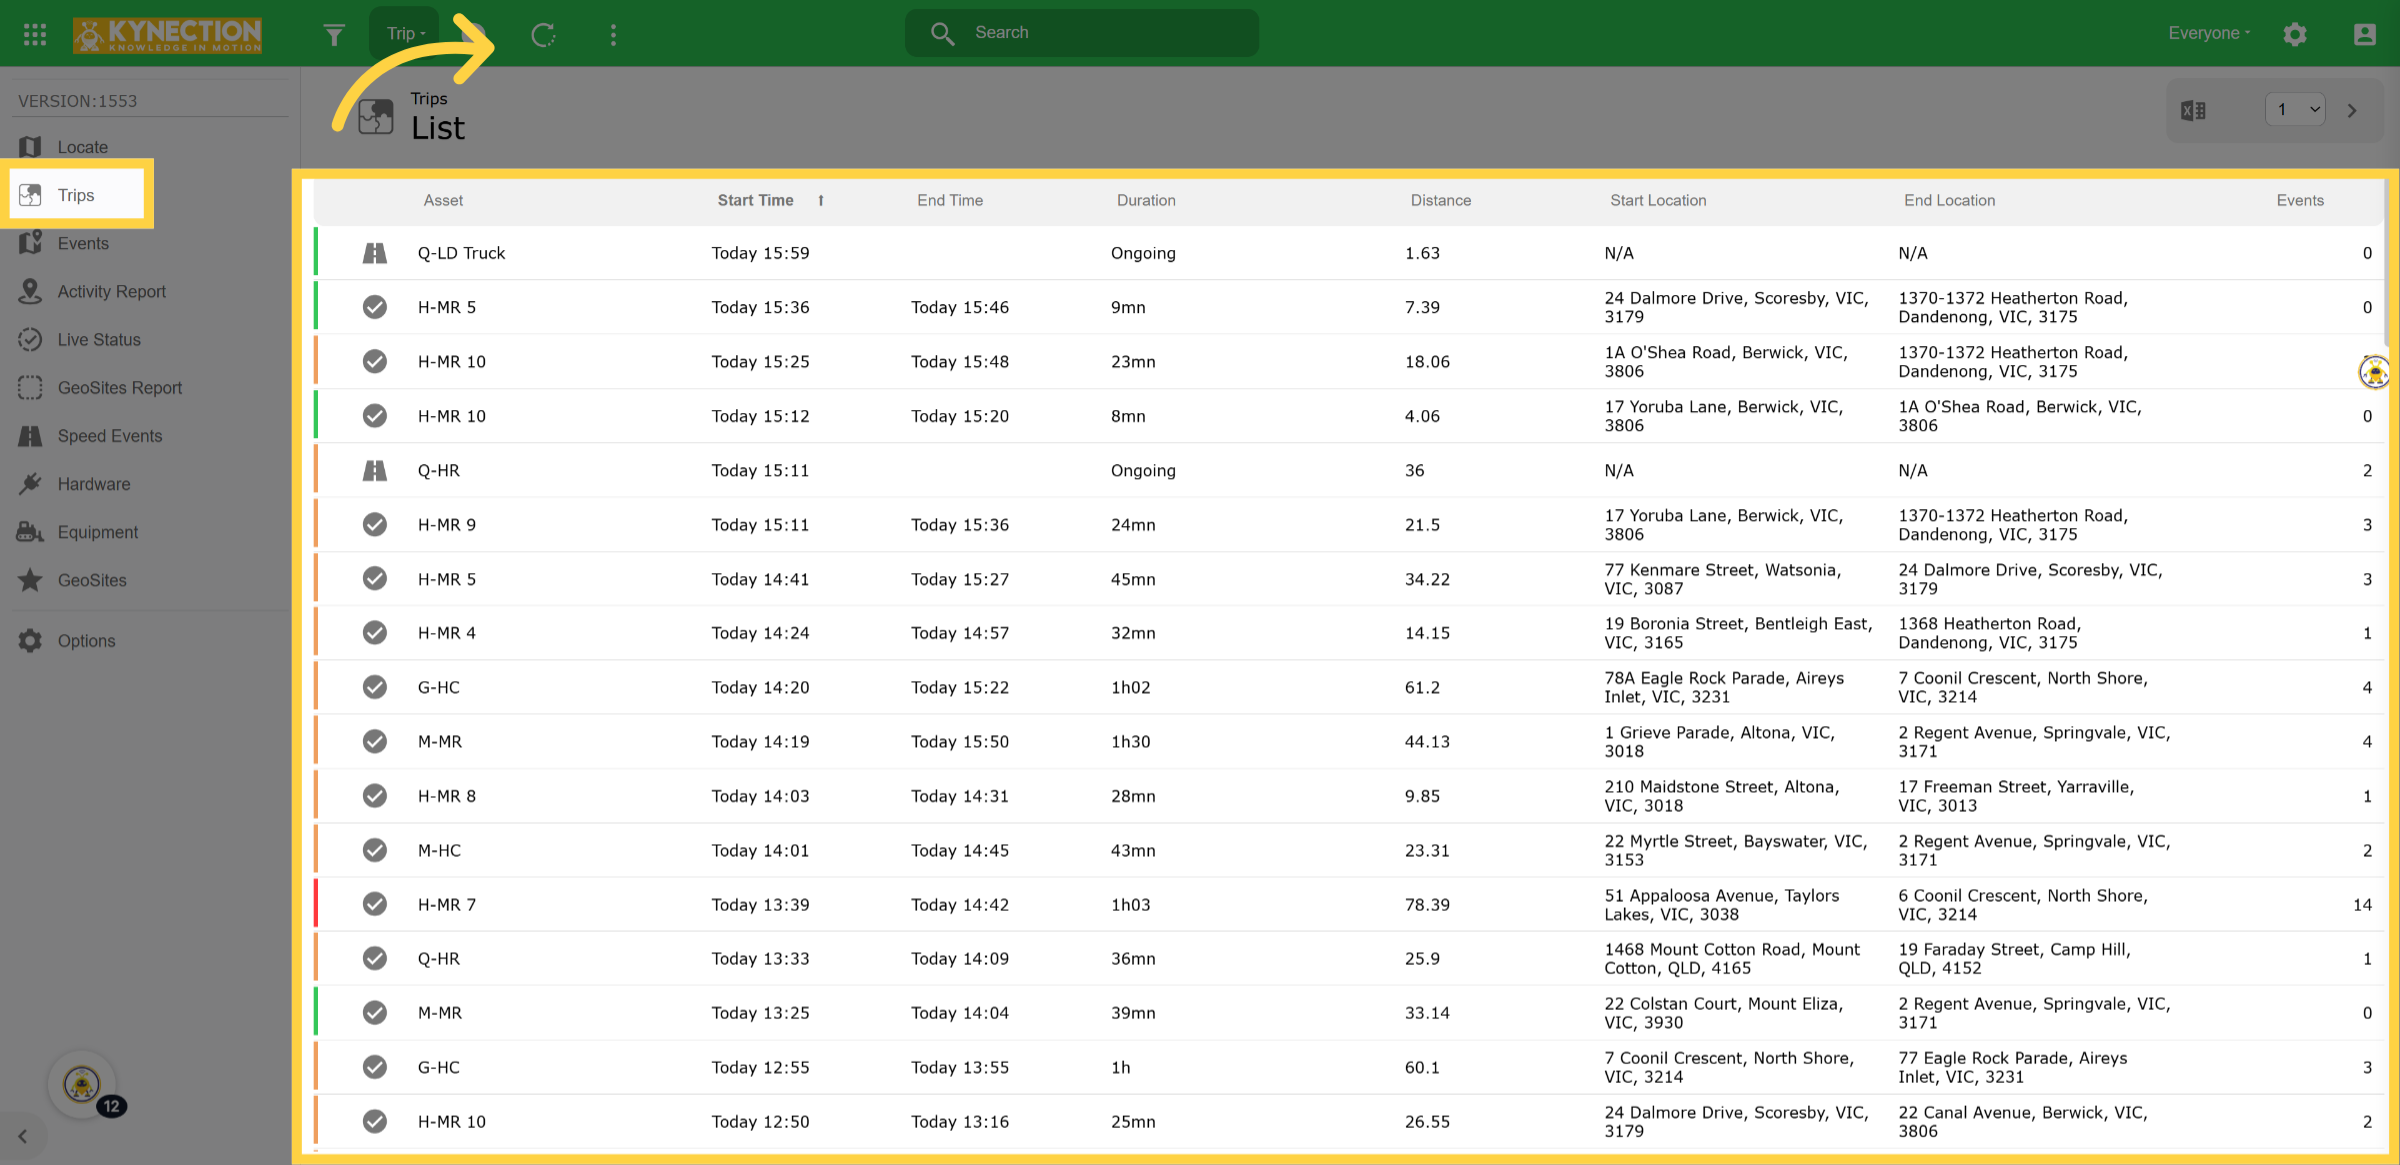
10. Filter
The filter option enables you to view the vehicle's journey by trip, day, or week.
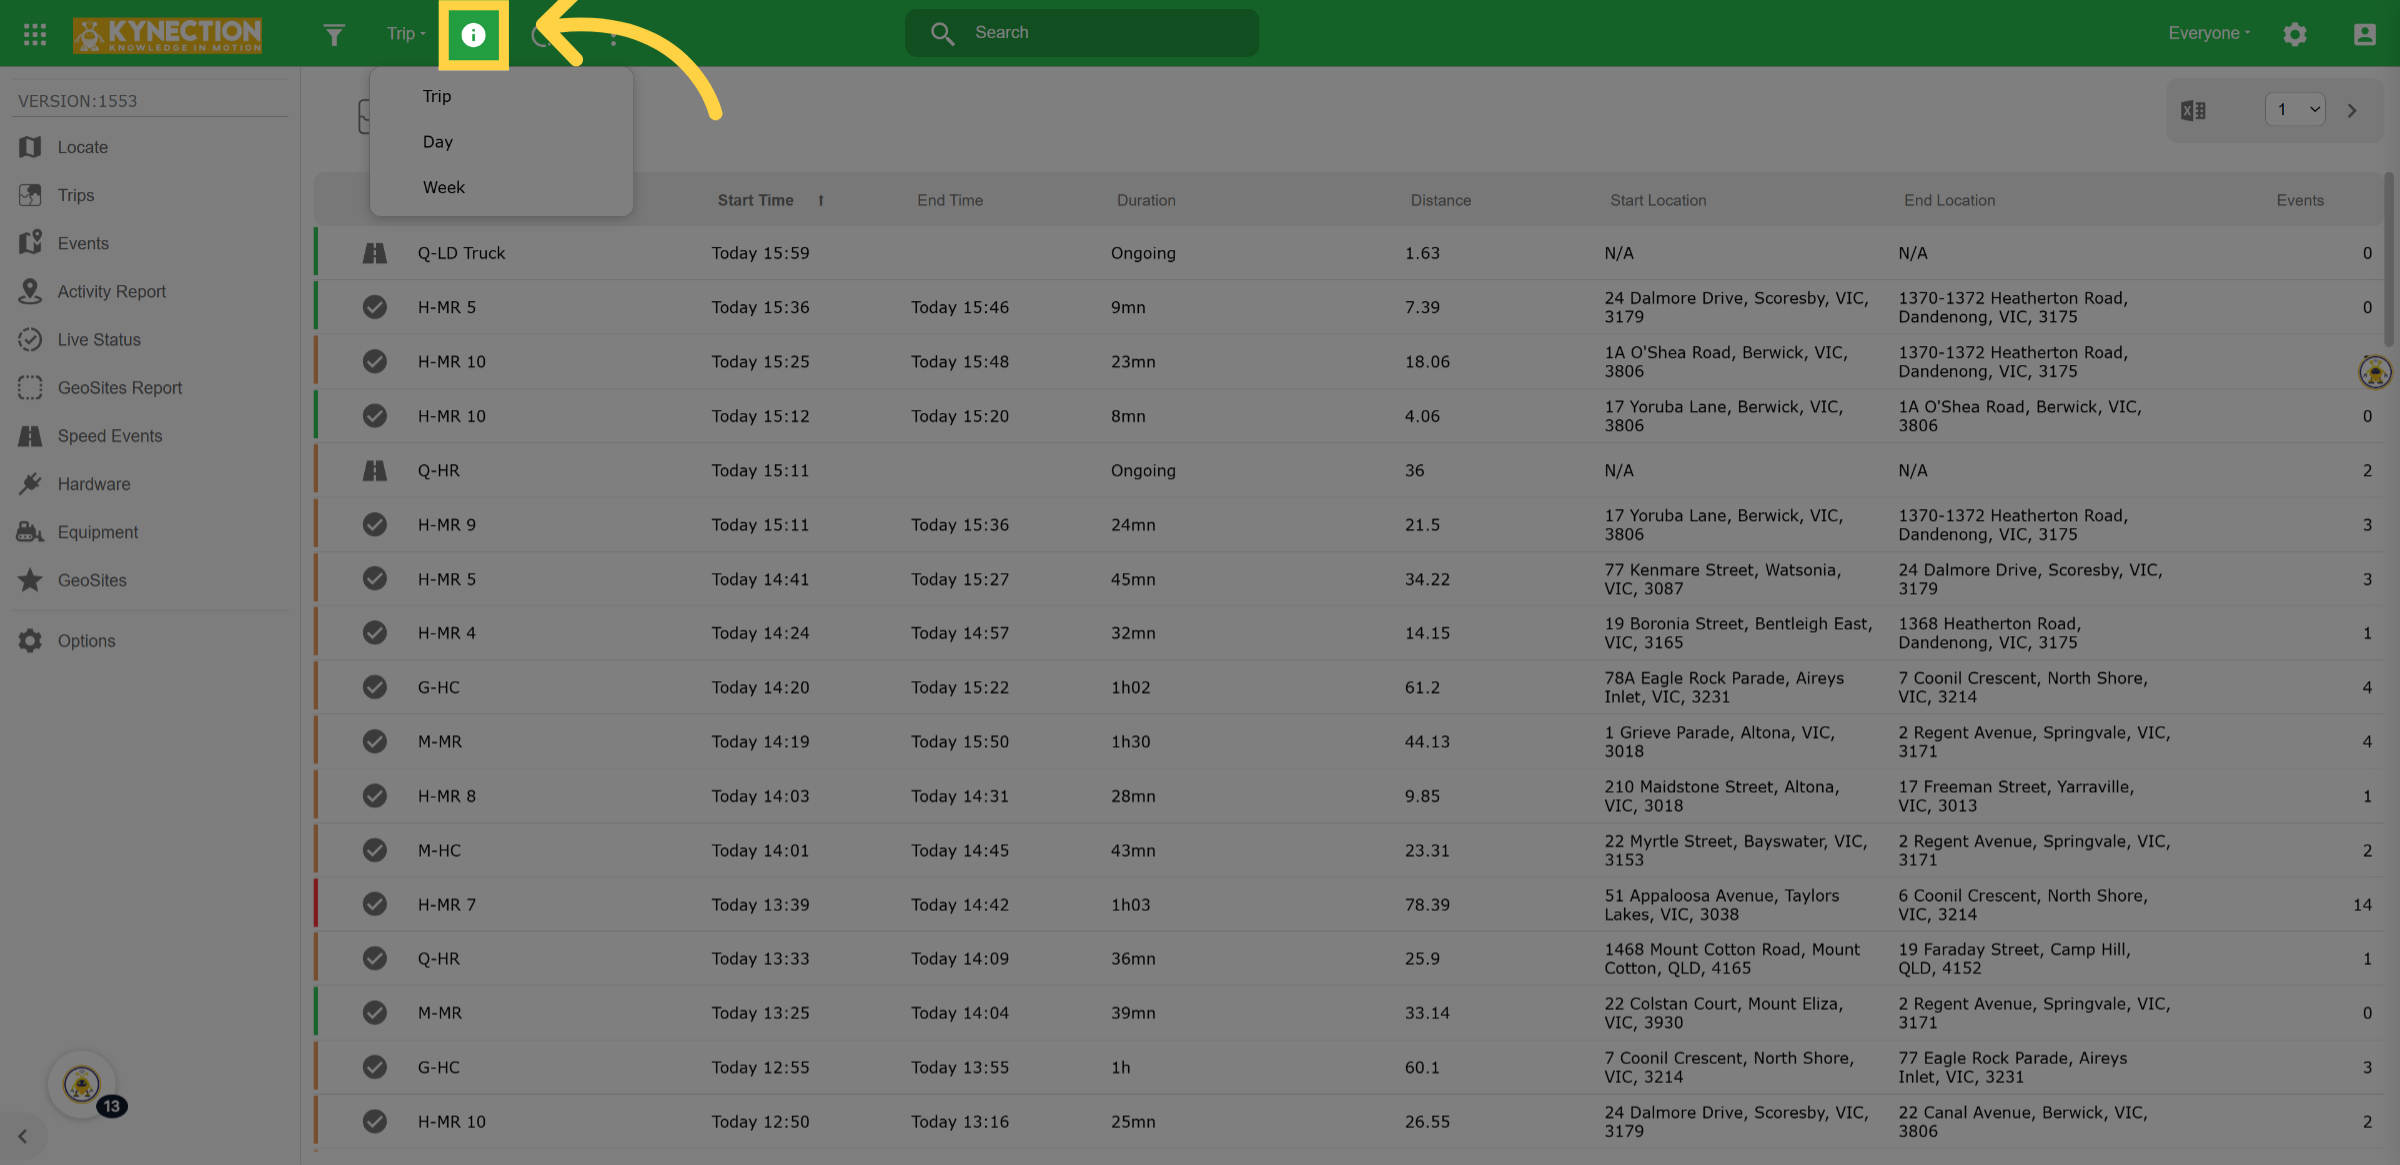
11. Legend
The legend shows icons for ongoing and completed trips.
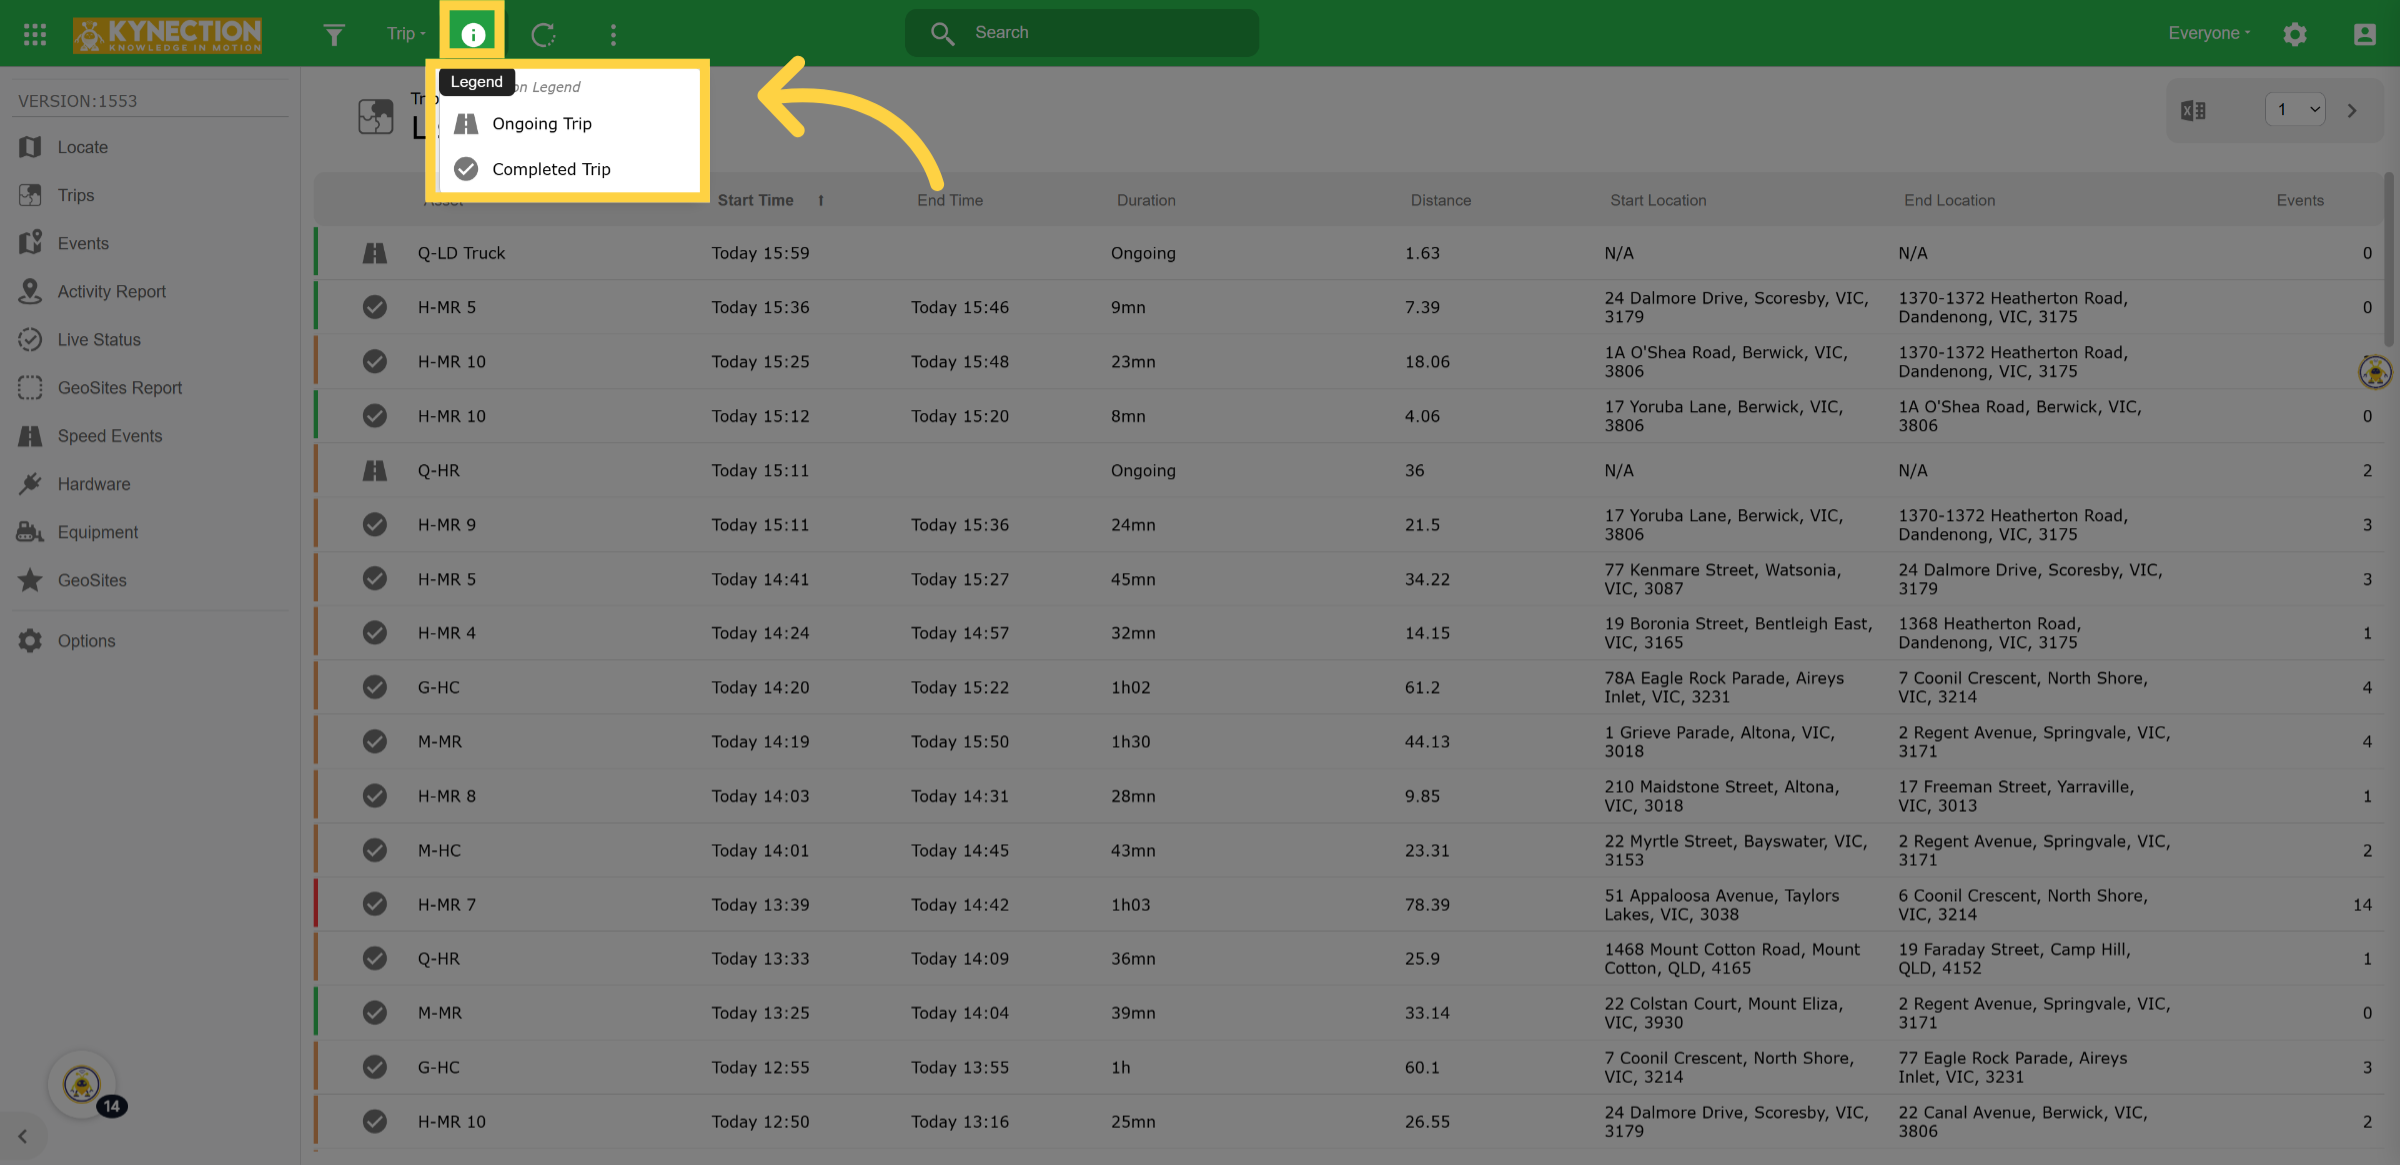
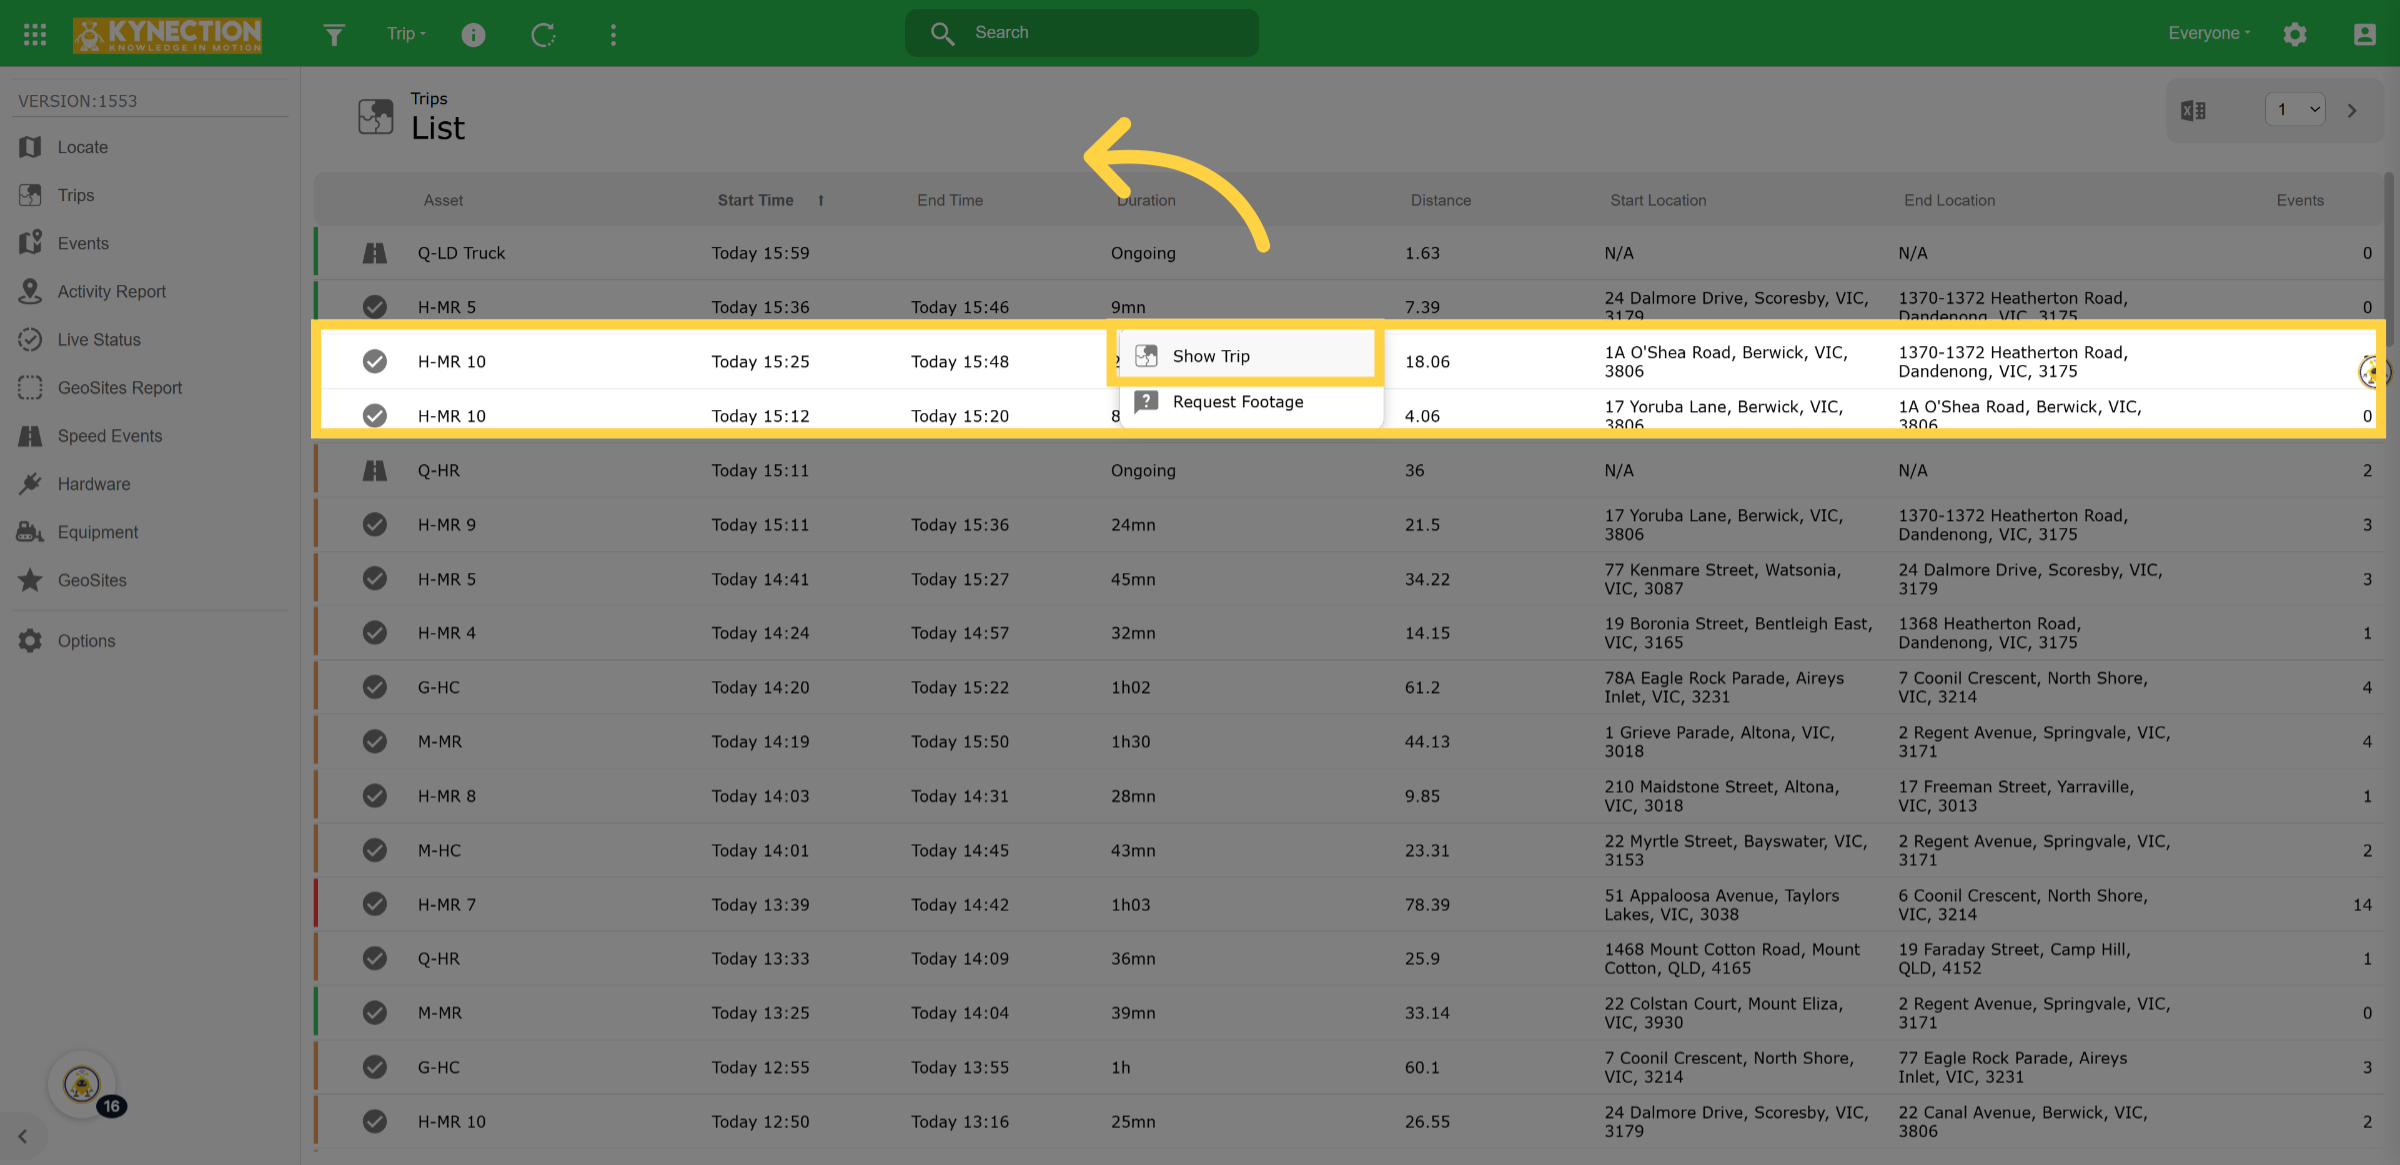
12. Show Trip Route
Here’s a comprehensive example of a vehicle's trip history, illustrating the various journeys and routes taken during a specified period of time. This information can be invaluable for understanding travel patterns, vehicle usage, and optimizing future routes.
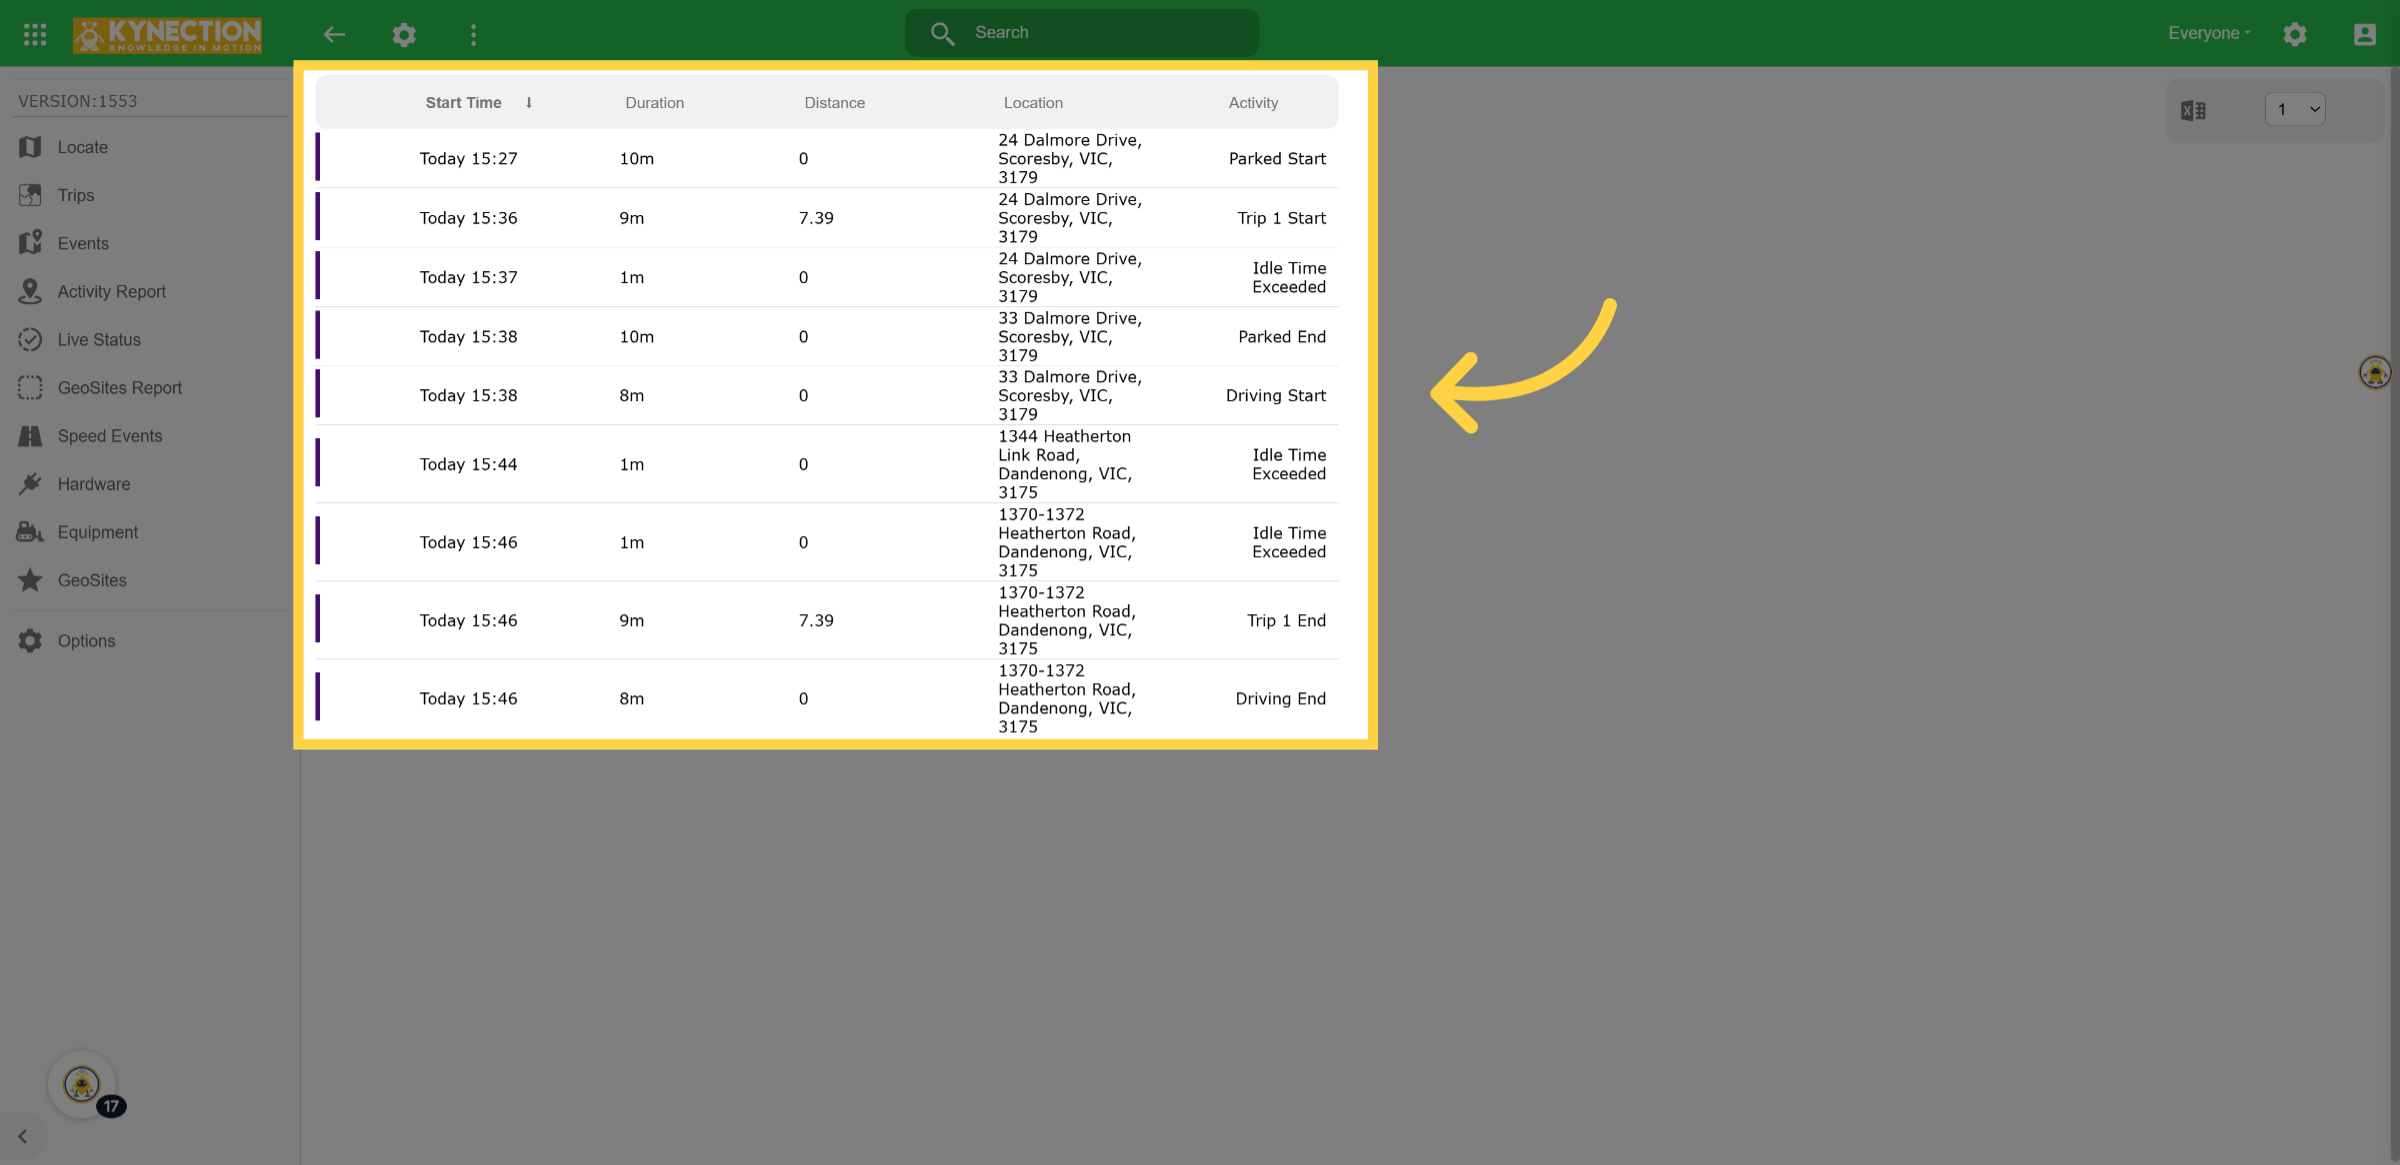
13. Activity Report
The activity report will provide a comprehensive overview of this specific asset's journey.
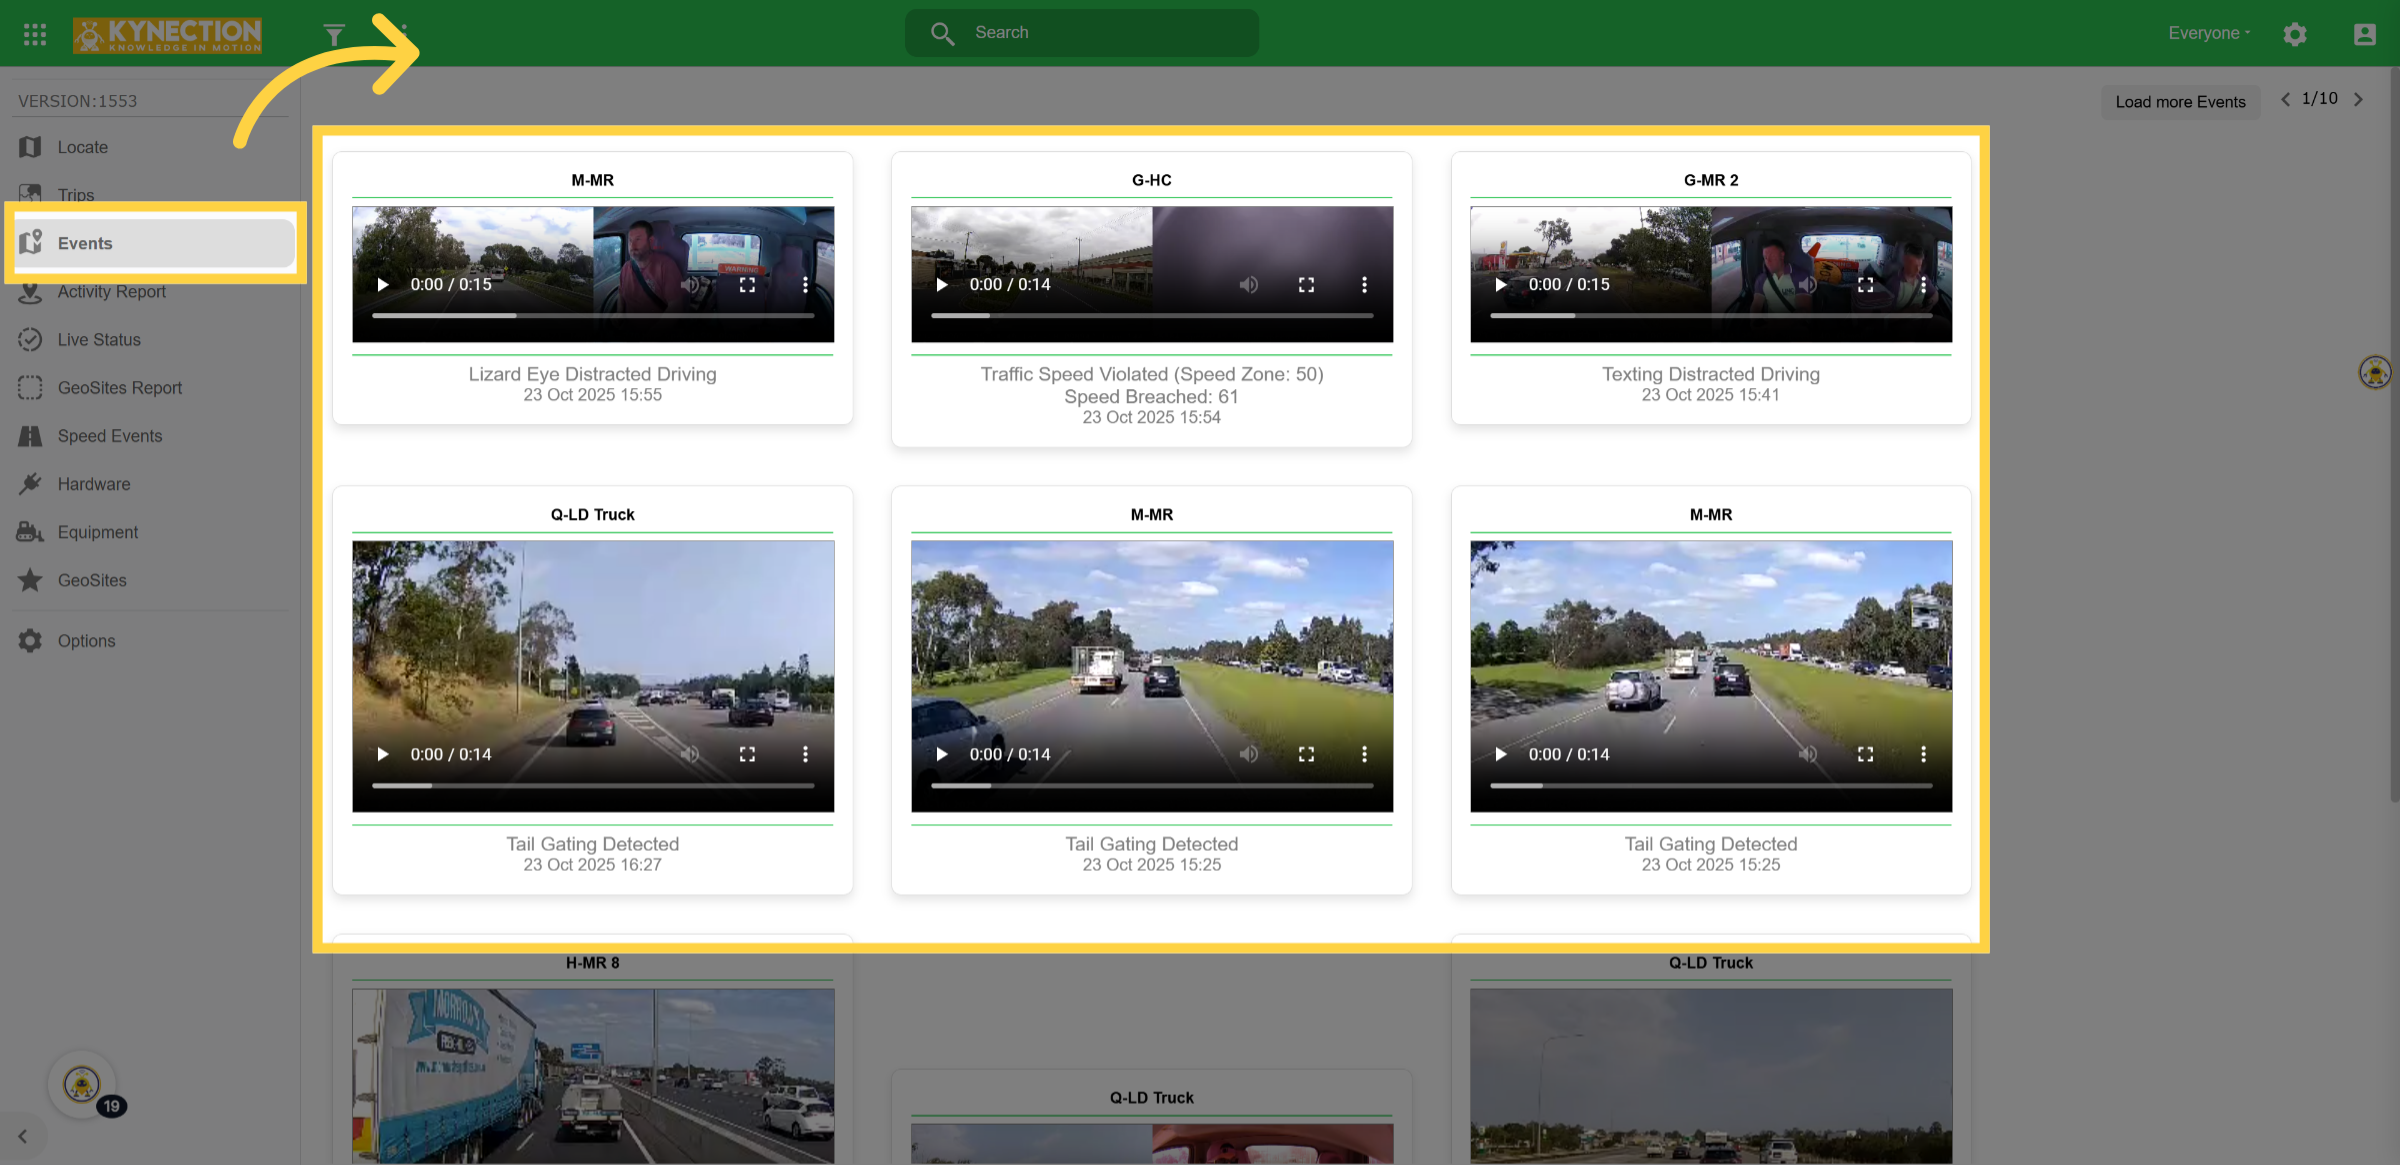
14. Events Tab
If you're using our AI camera systems, the Events tab displays various incidents, including drowsy driving, speed violations, and more.
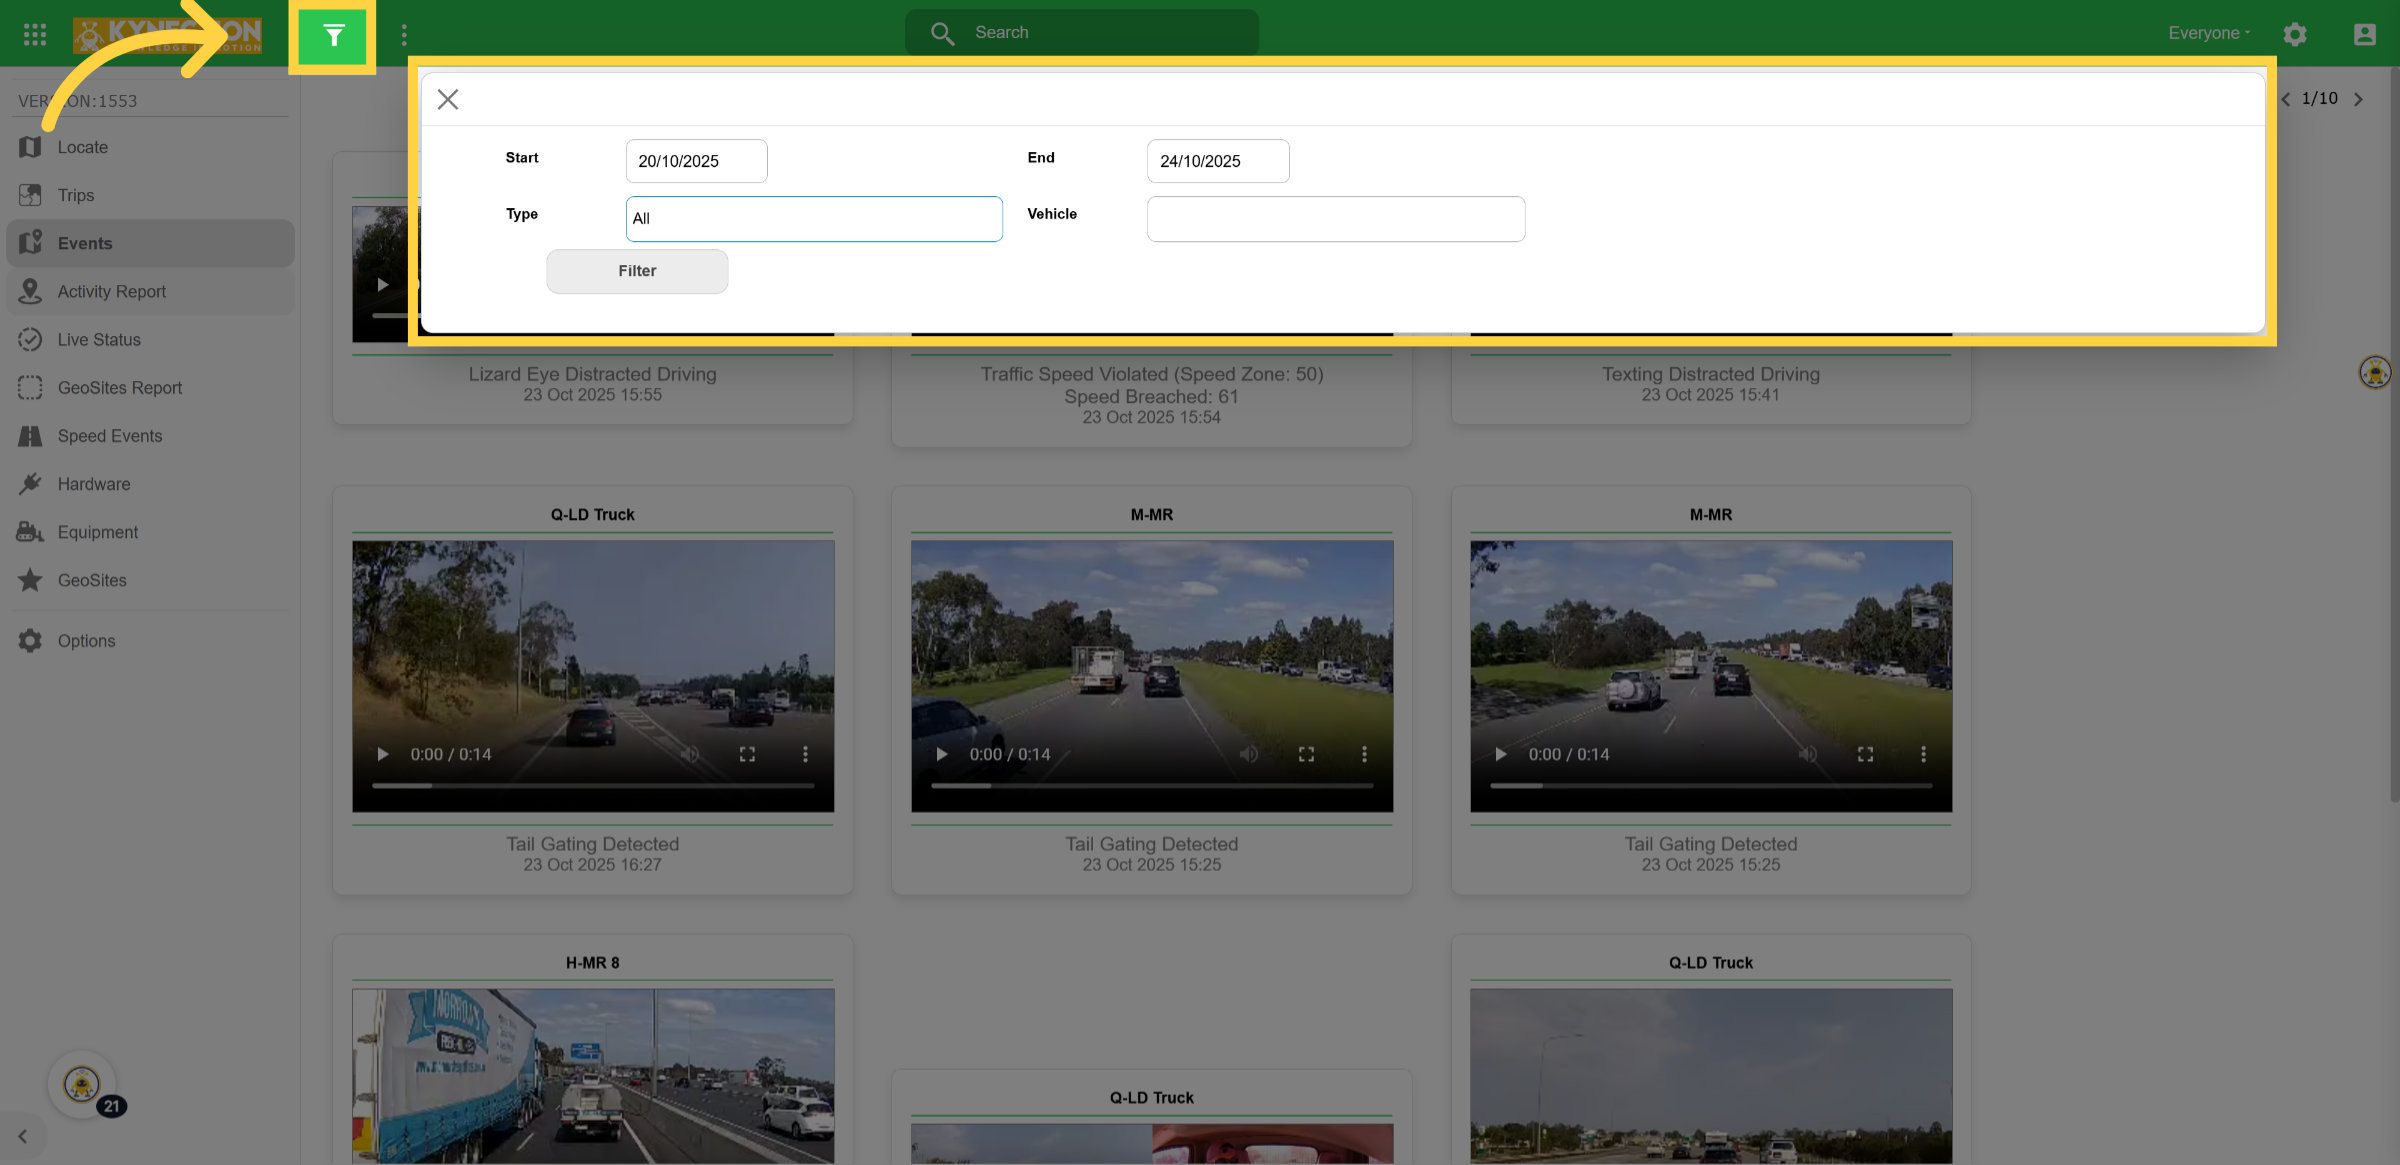
15. Filter
The filter option enables you to refine your search by date range, type, and vehicle.
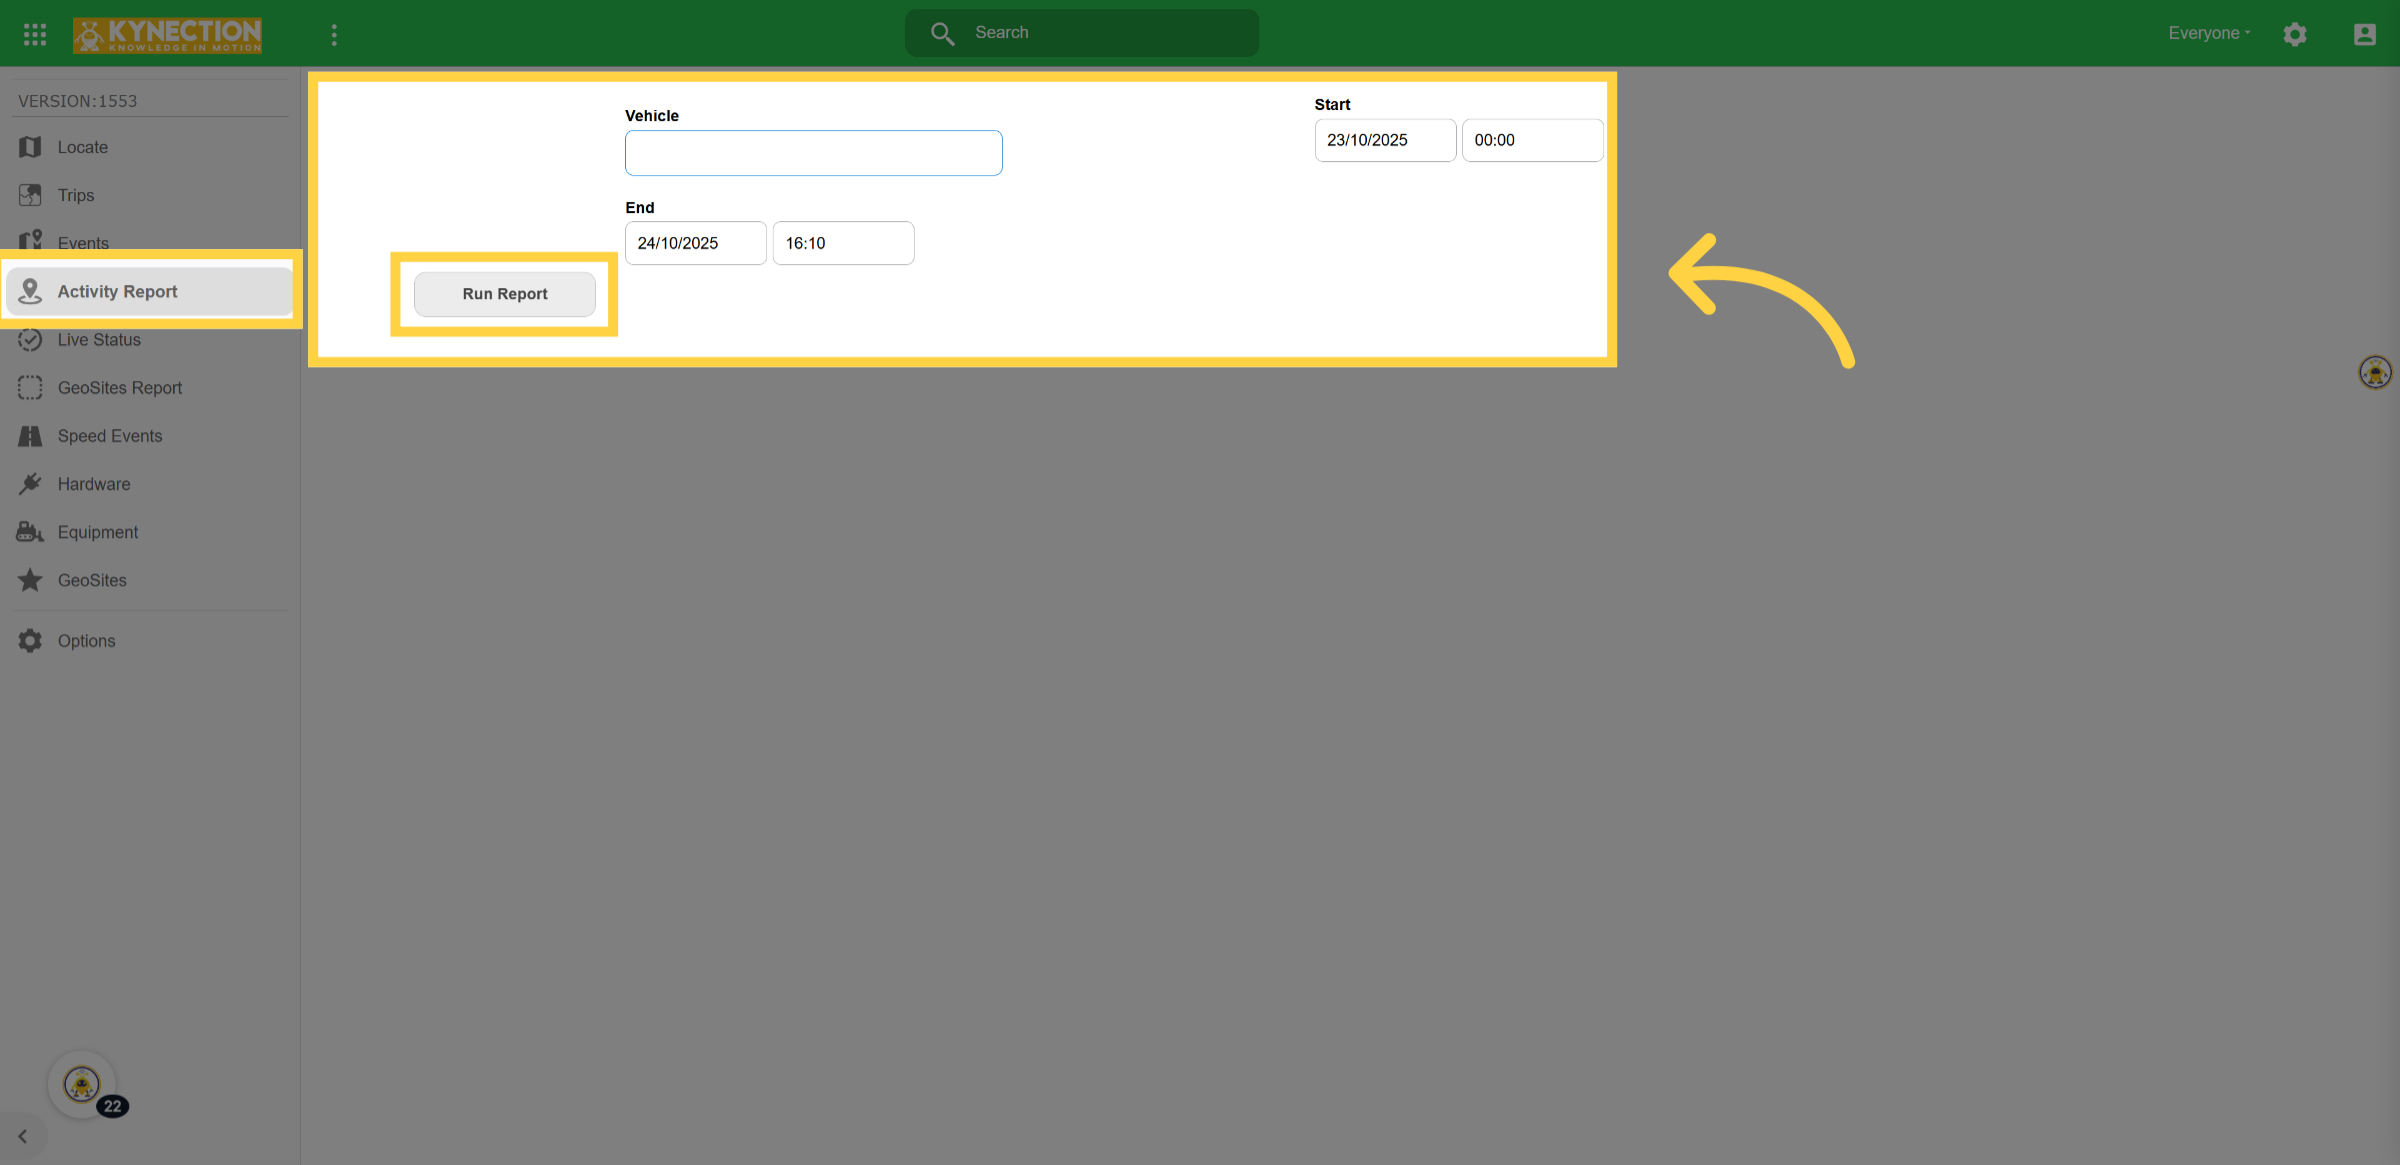
16. Activity Report
You can create run reports by selecting the vehicle and date range.
17. Run Report
In this example, you can view a comprehensive report of a specific vehicle within the outlined date range, providing detailed insights and data regarding its performance and usage during that period.
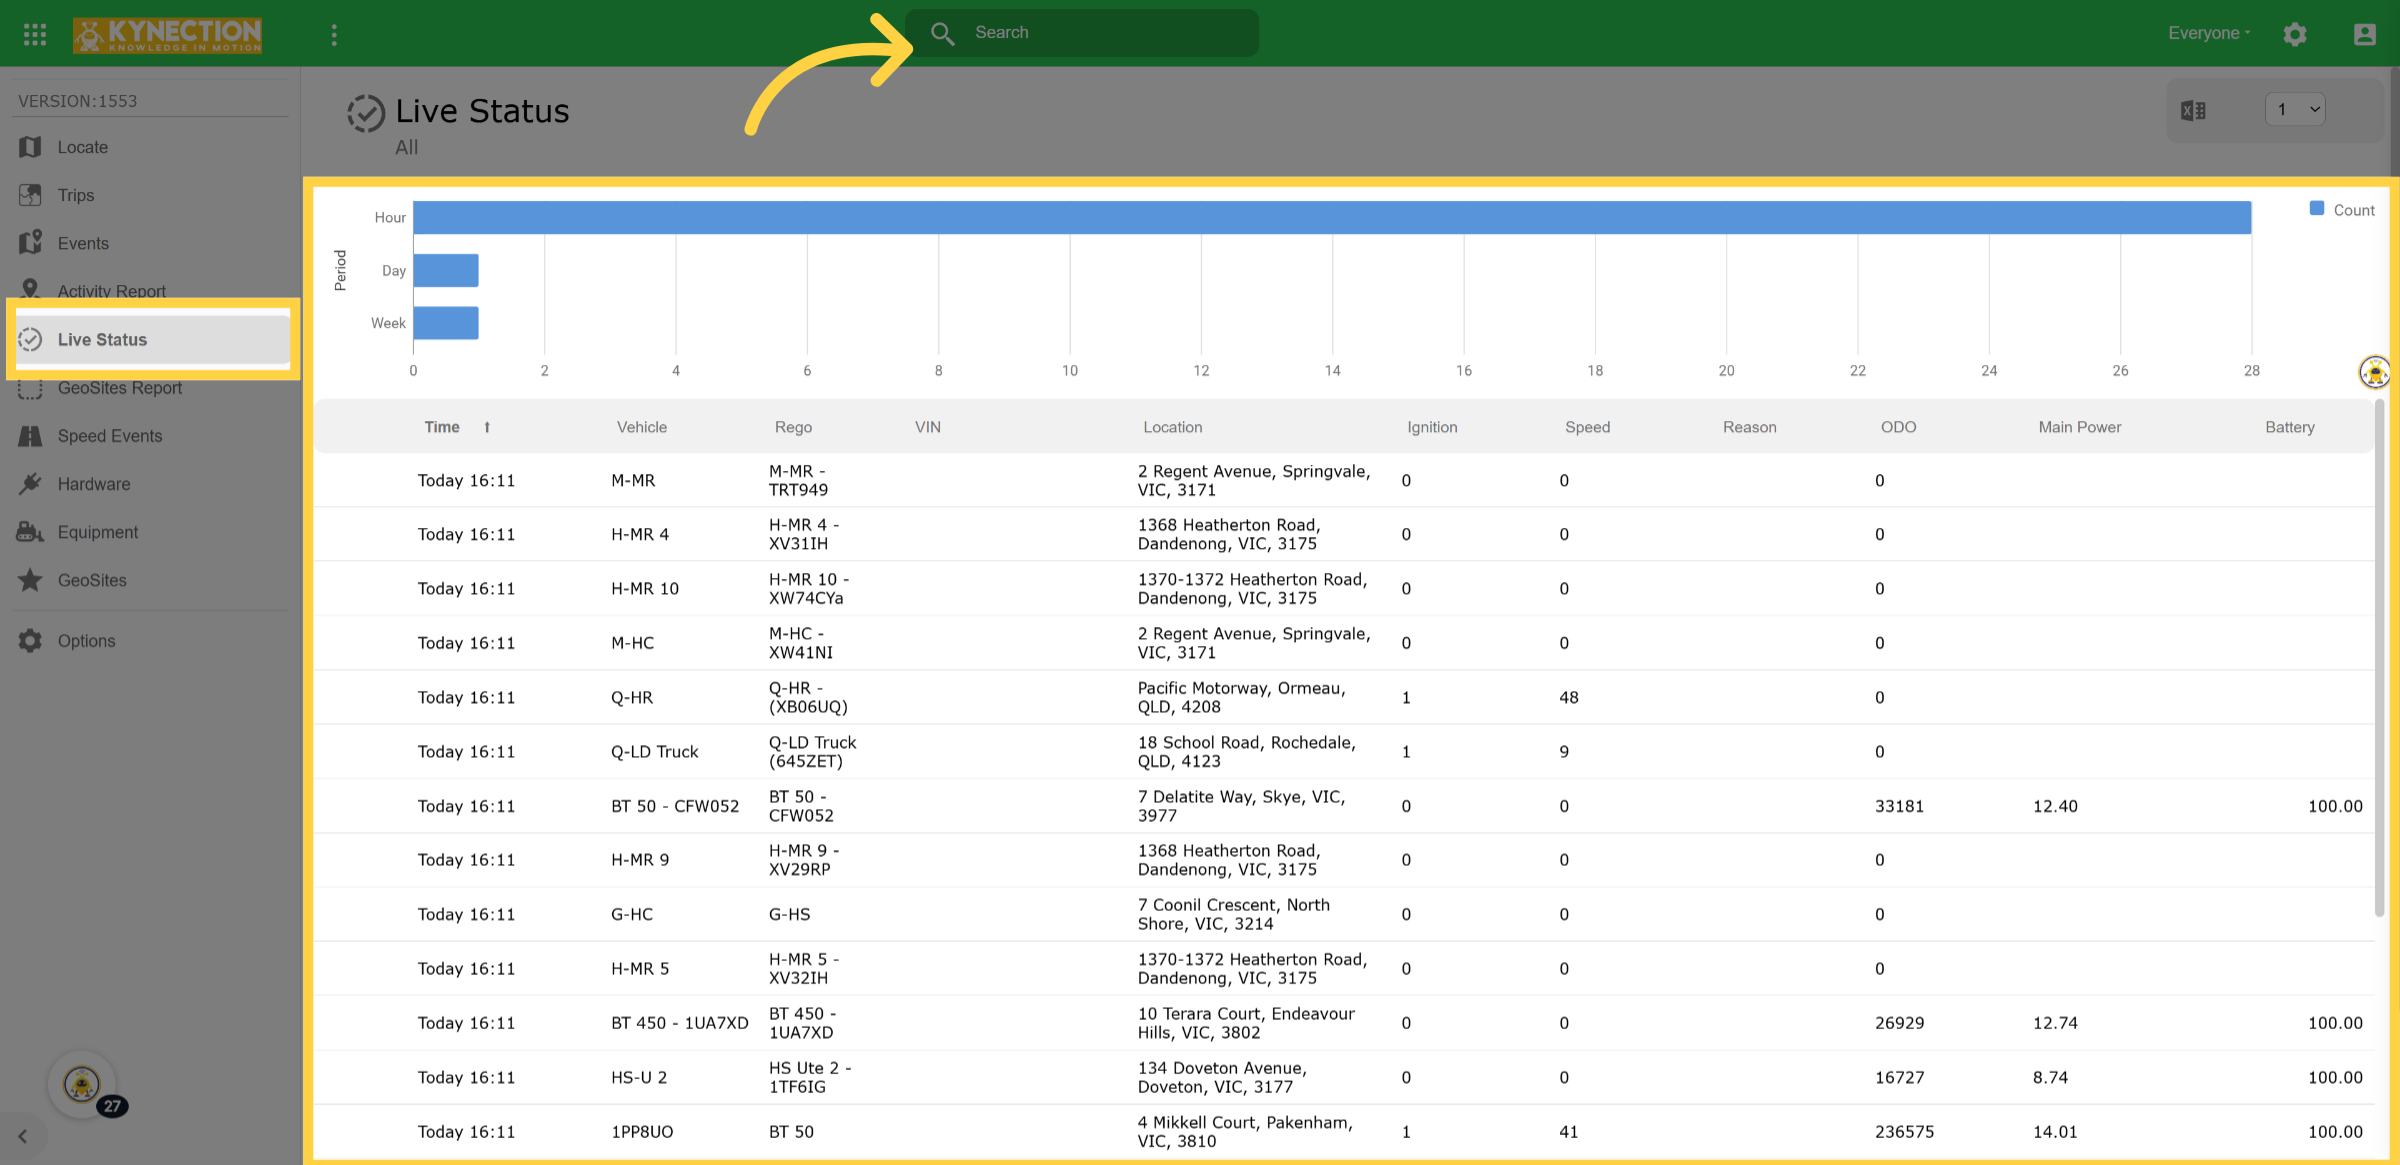
18. Live Status
The live status tab enables you to monitor the status of each asset in real-time.
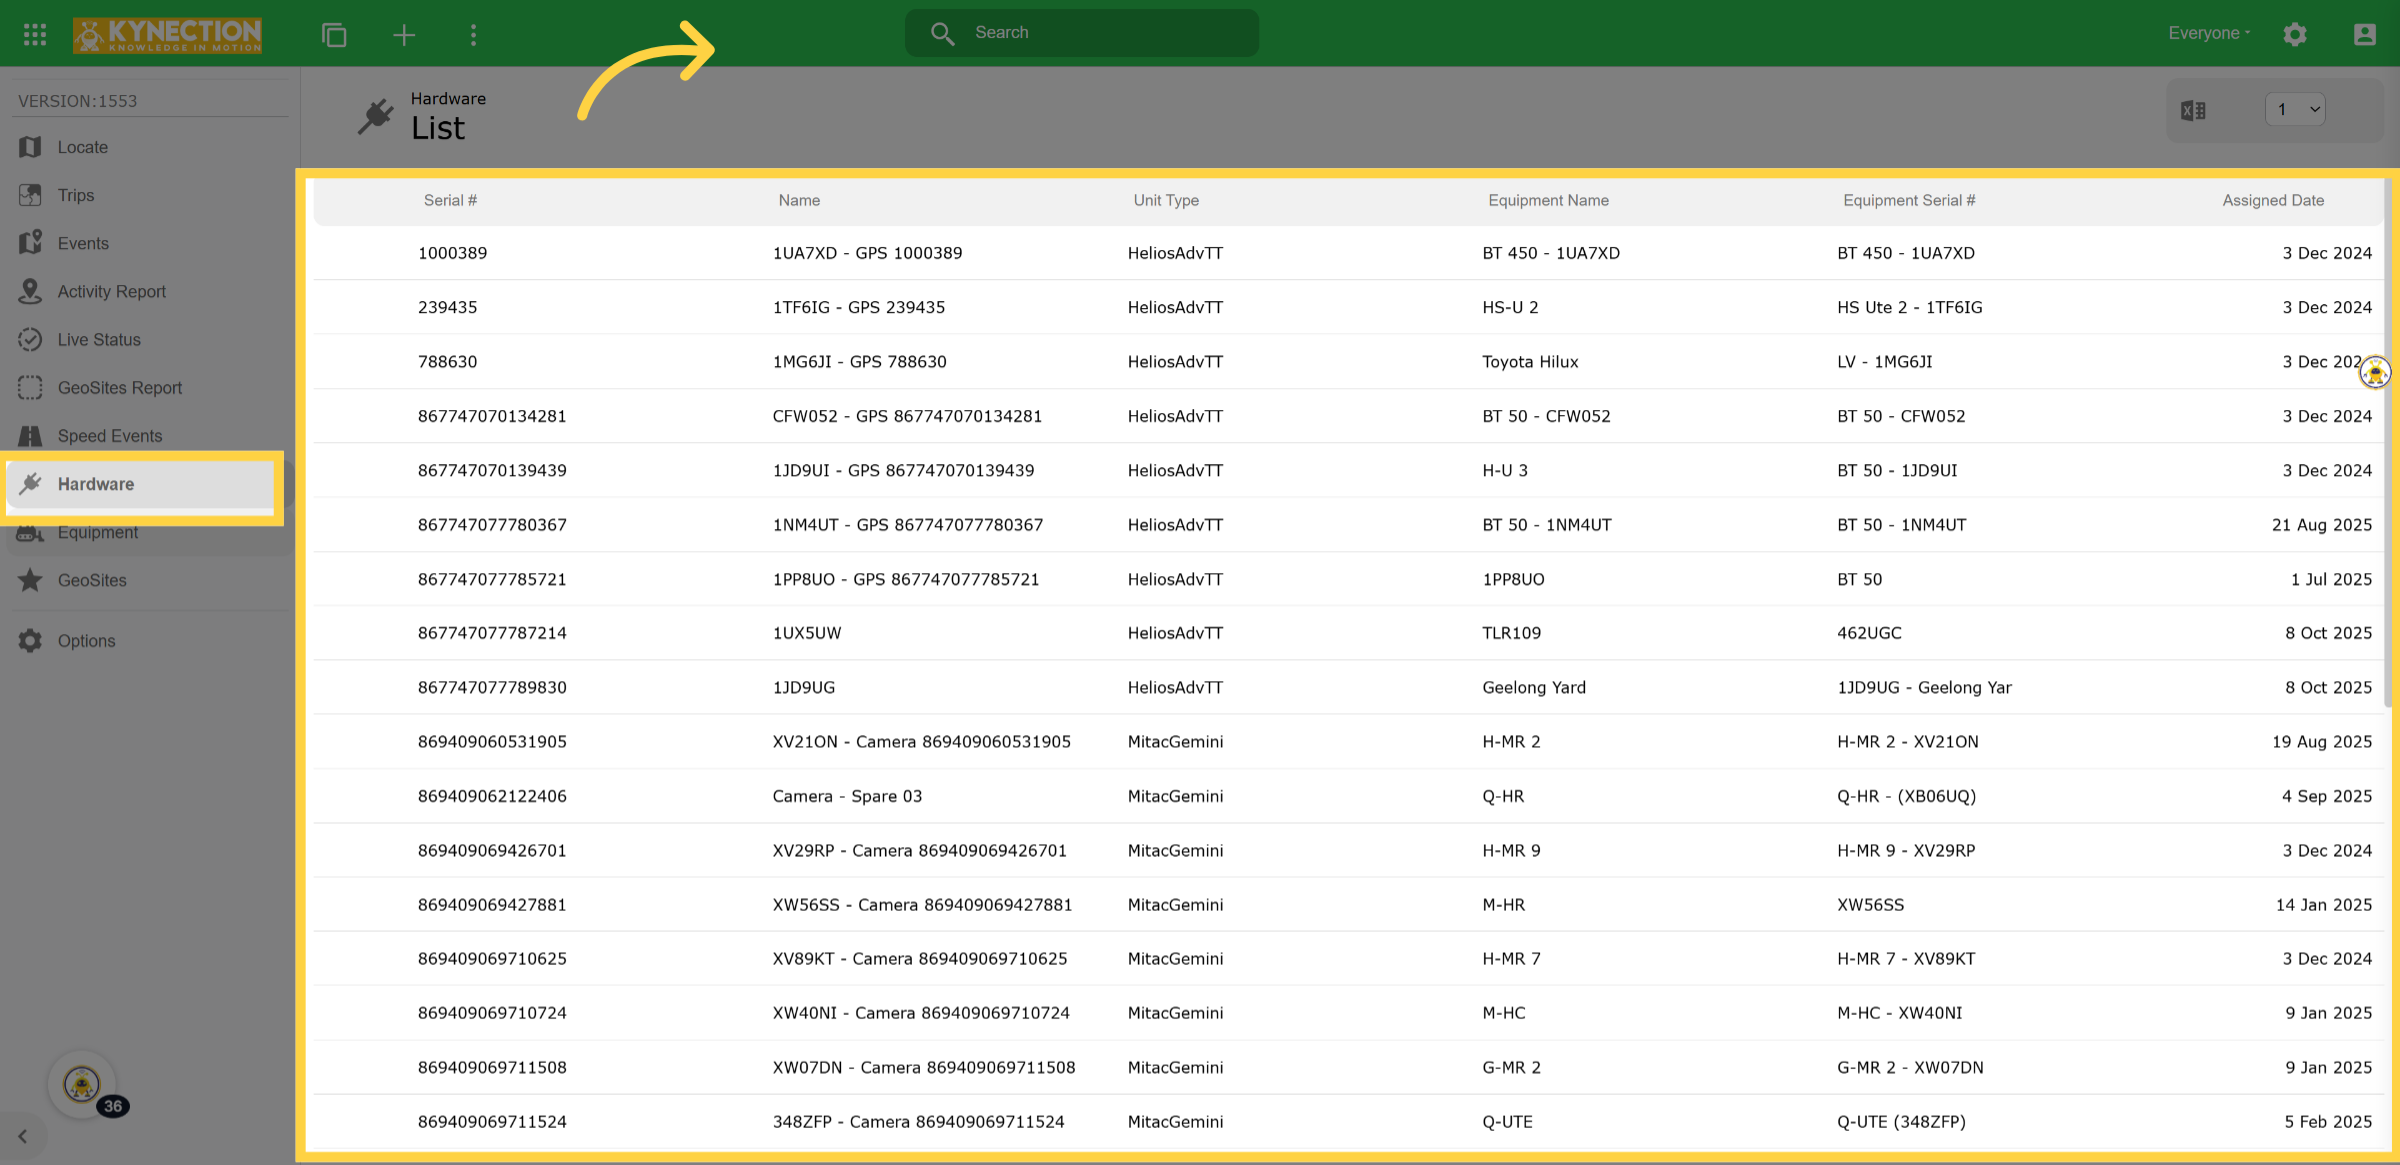
19. Hardware Tab
The hardware tab enables you to view and manage the list of hardware devices assigned to each vehicle.
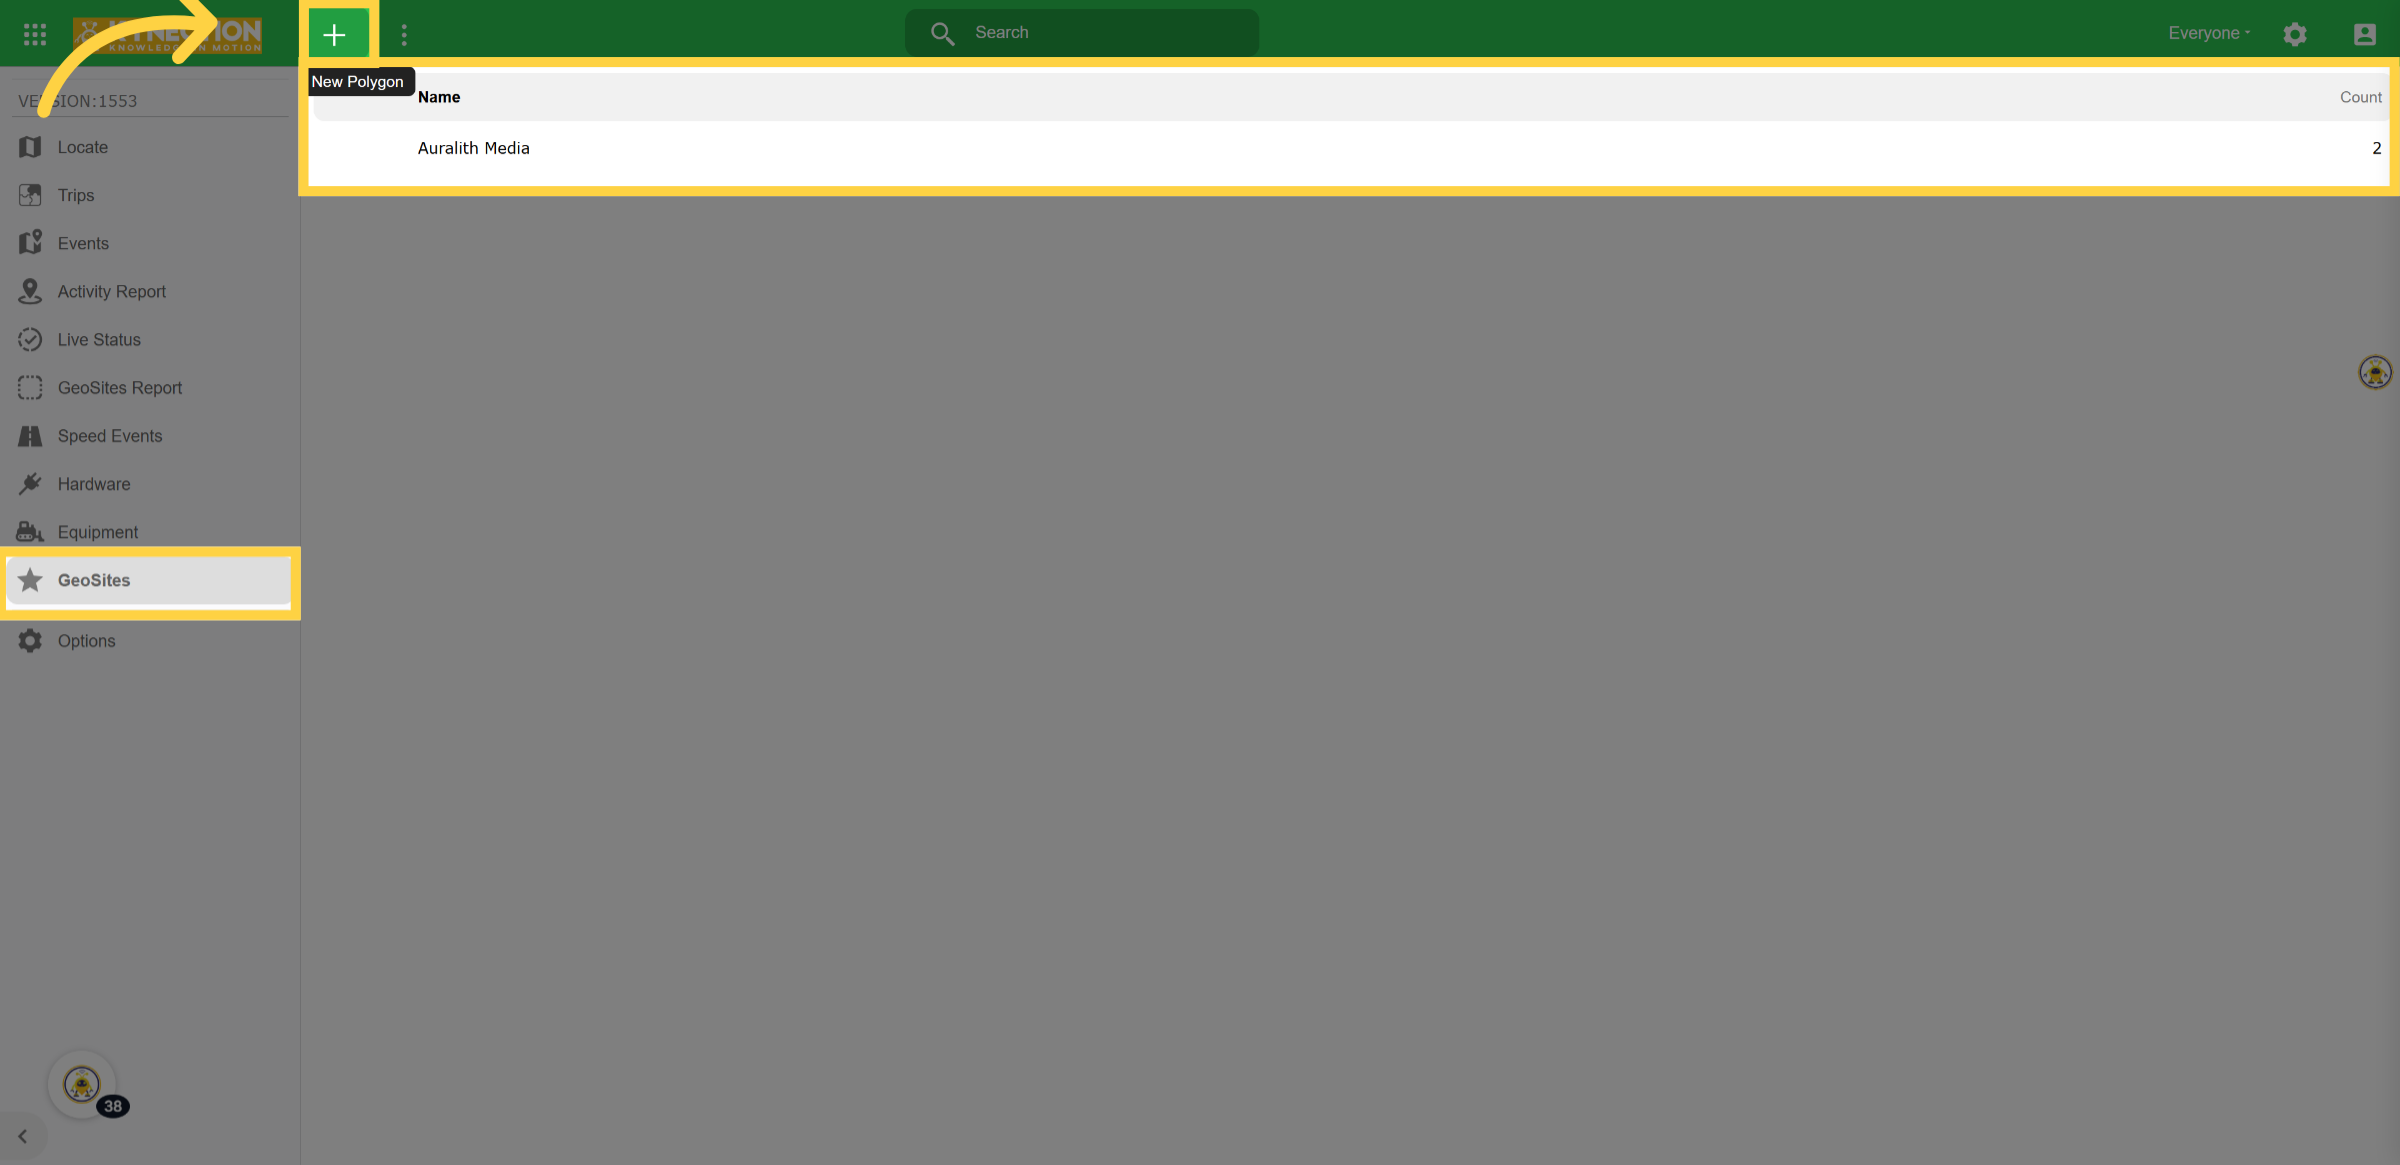
20. GeoSites
The geo sites feature enables you to view and create geo fence areas. Click the + icon to add a new polygon.
21. Fill in Details
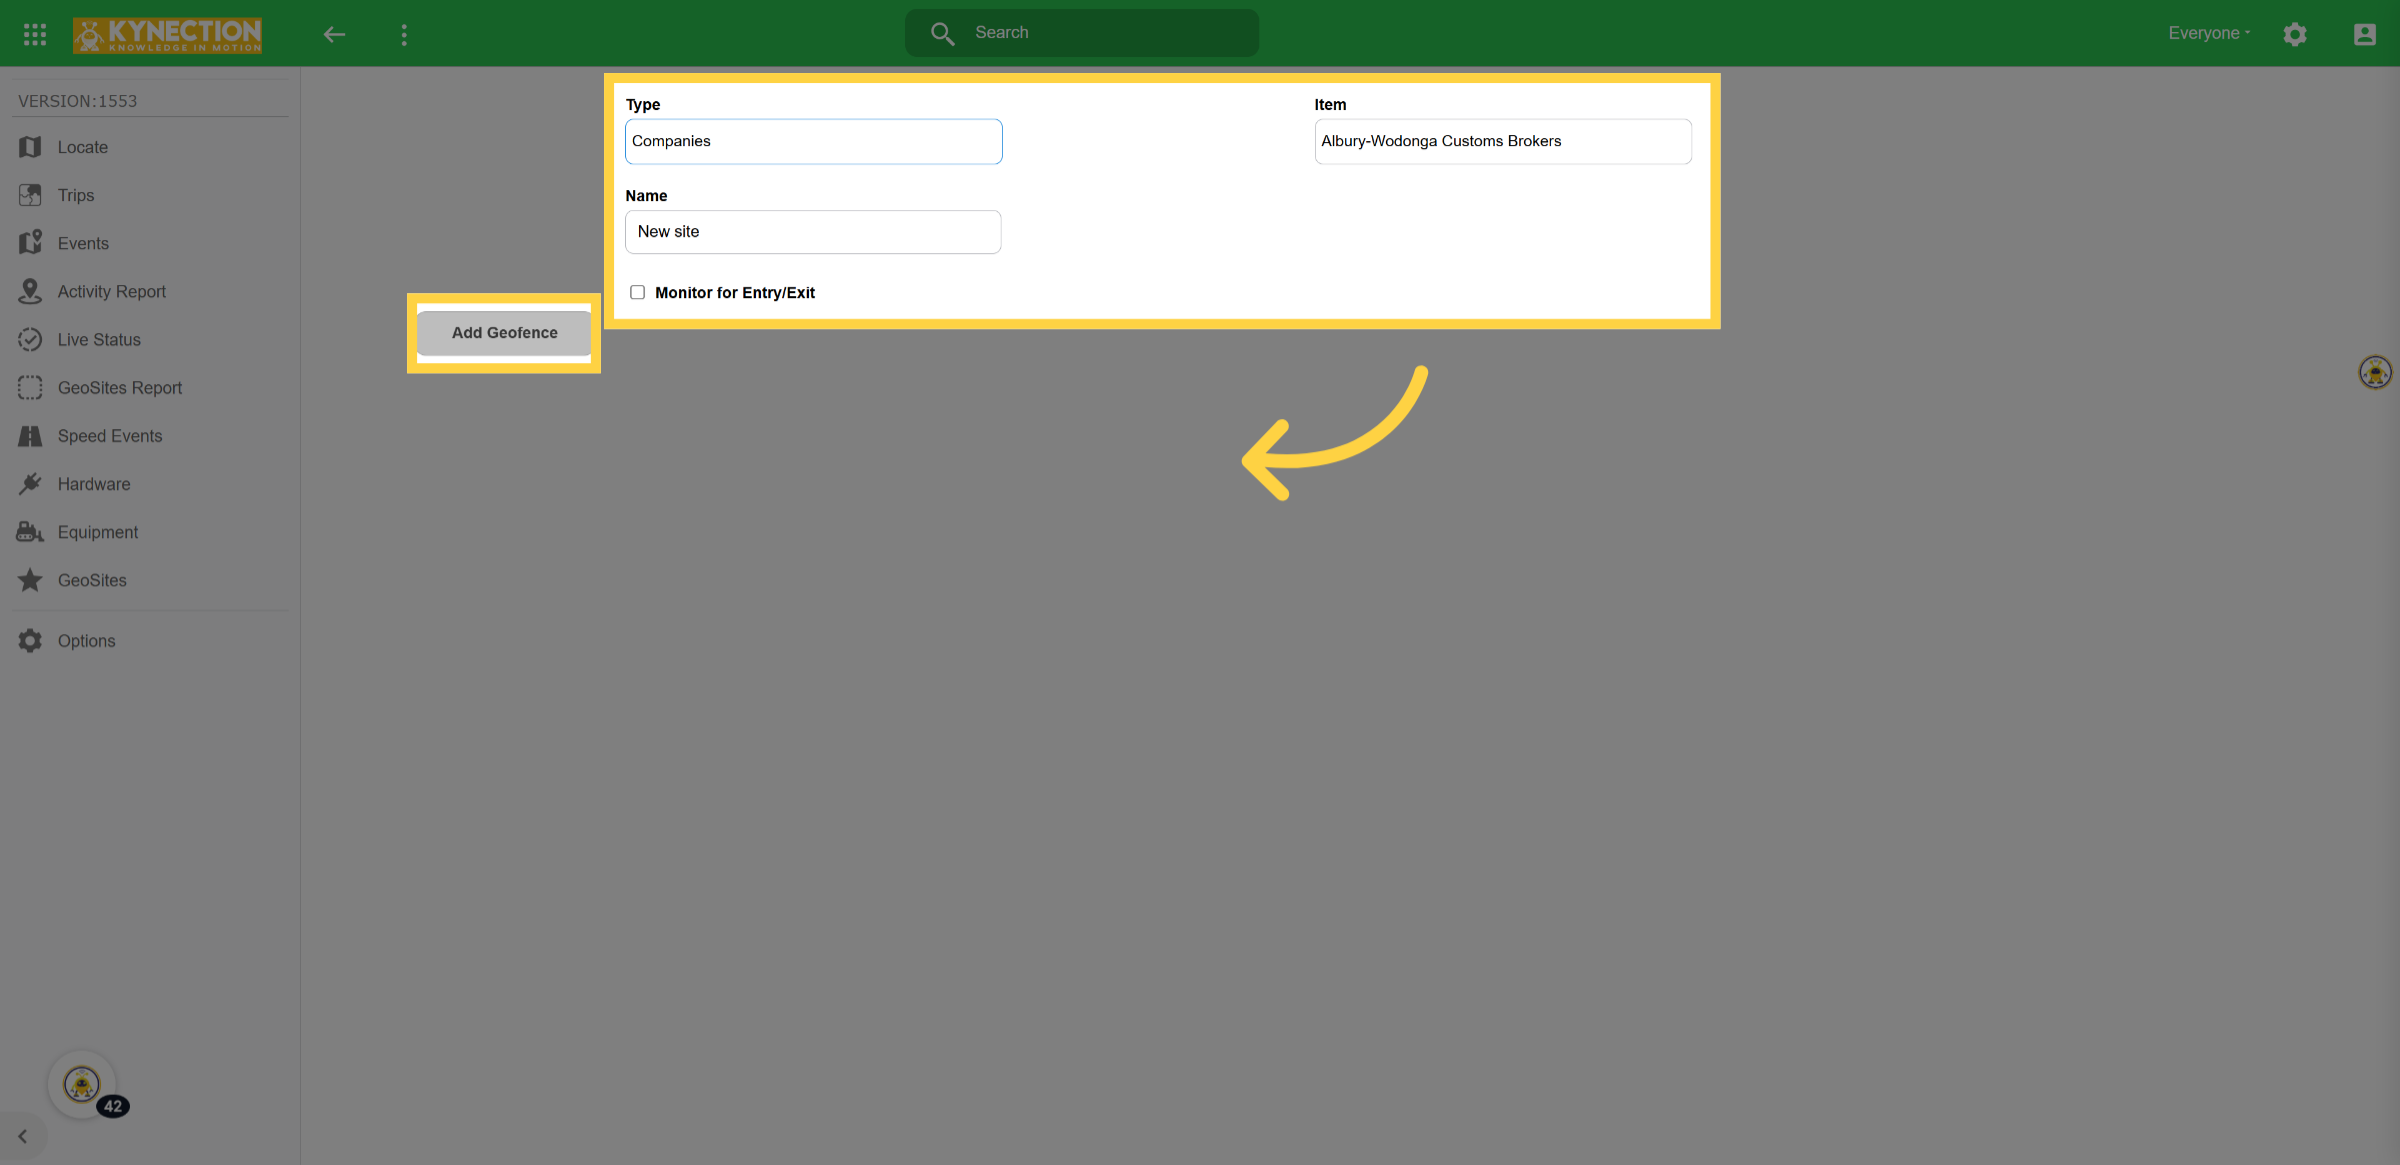
Please enter the name of your new site to specify the geo fence area you are creating or modifying.
22. Edit
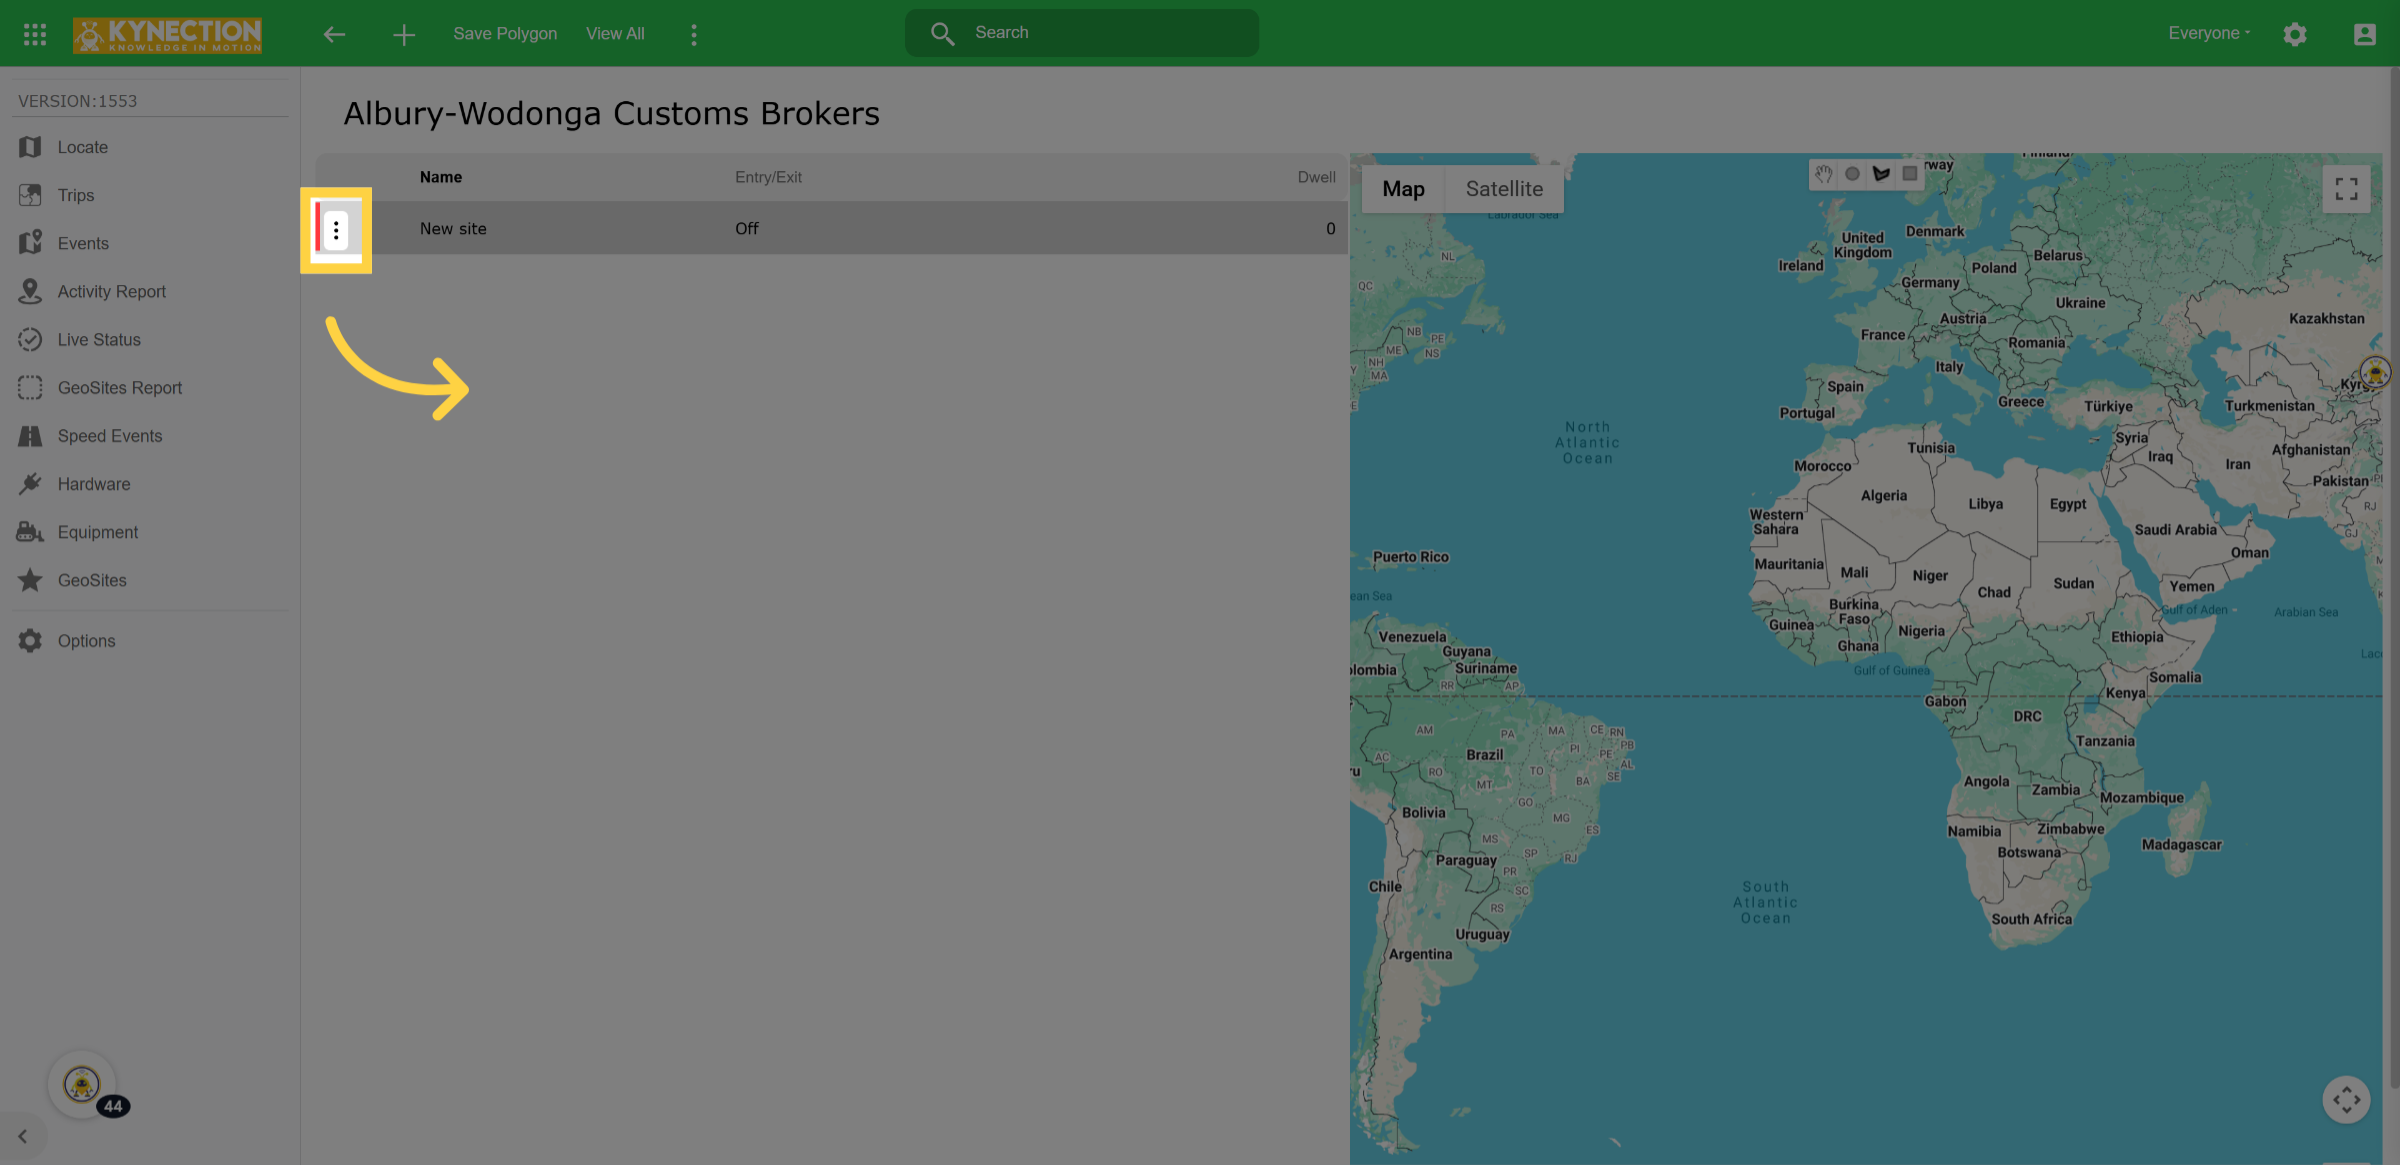
Select the 3 dots to edit
23. Open Geofence Editing
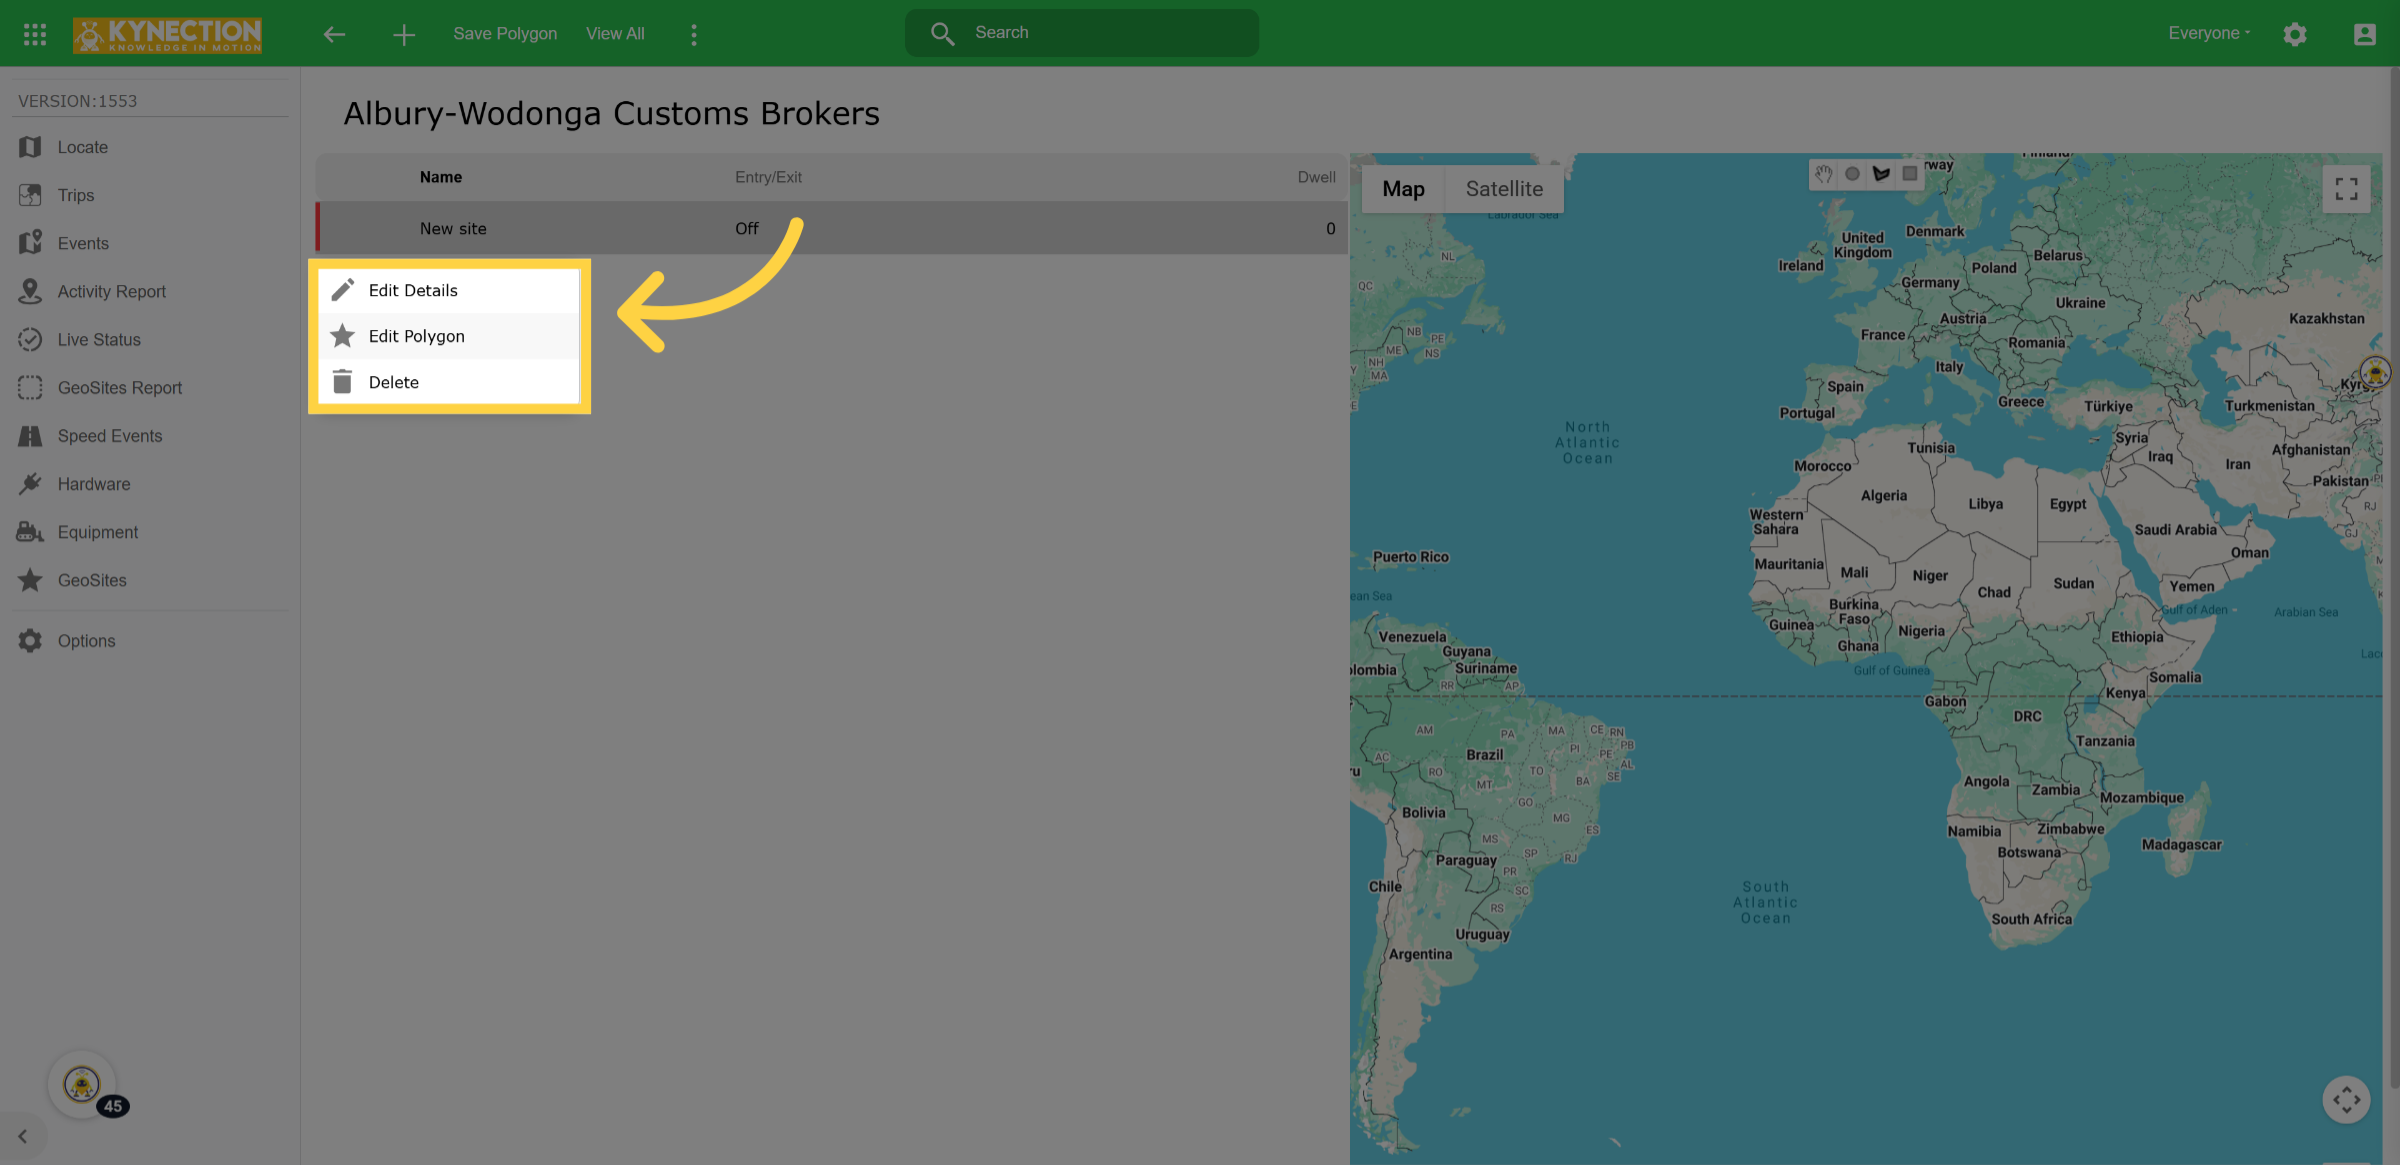
Editing the polygon shape of the geo fence area.
24. Create & Save Polygon
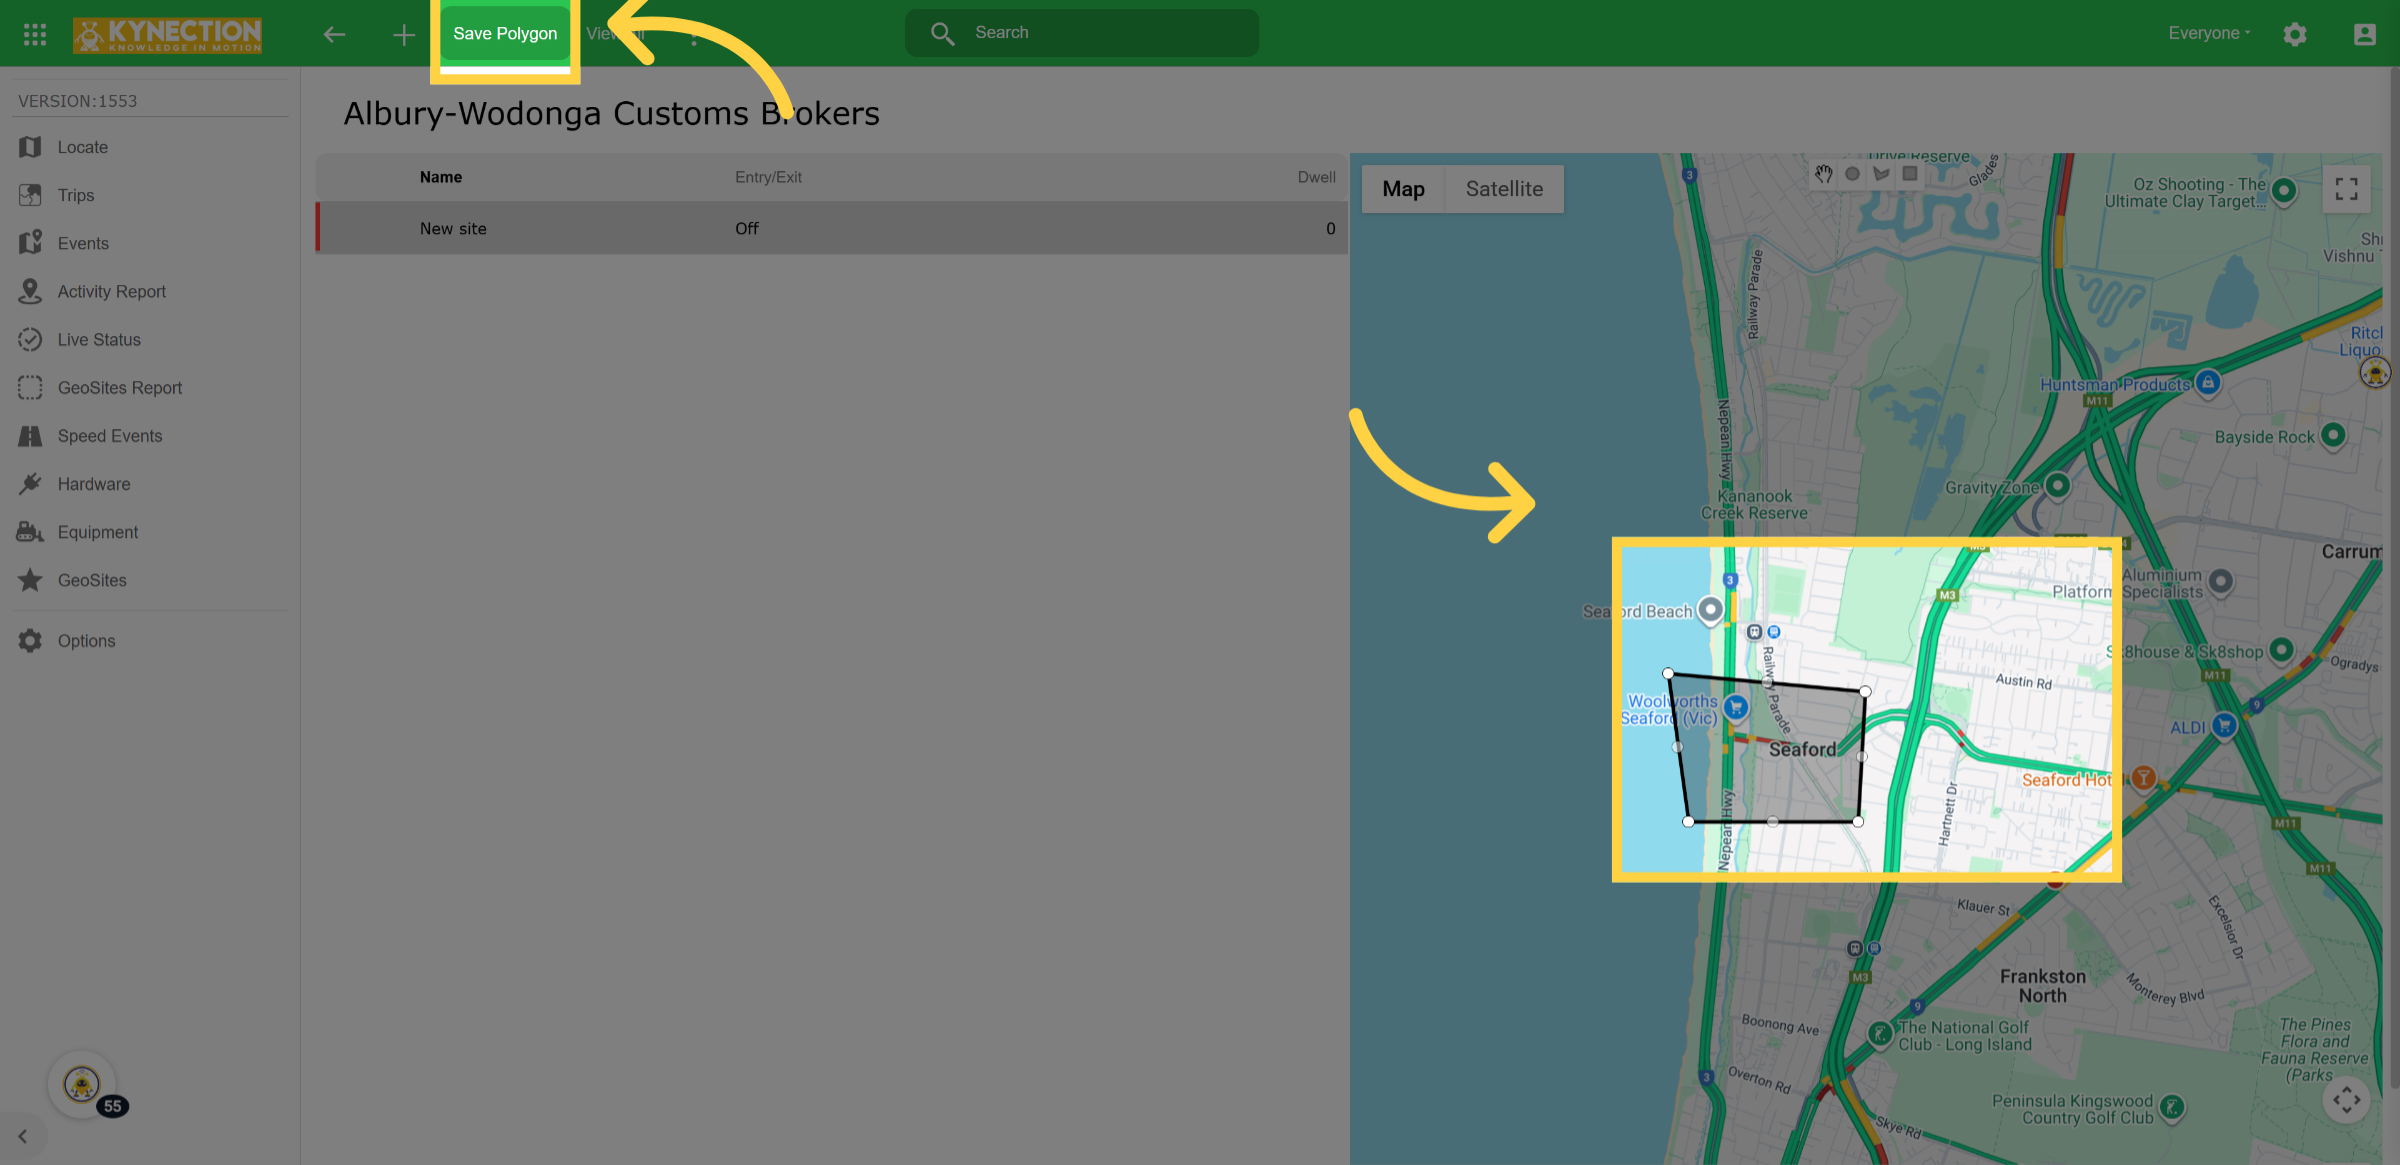
Please create and save the polygon.
25. Options
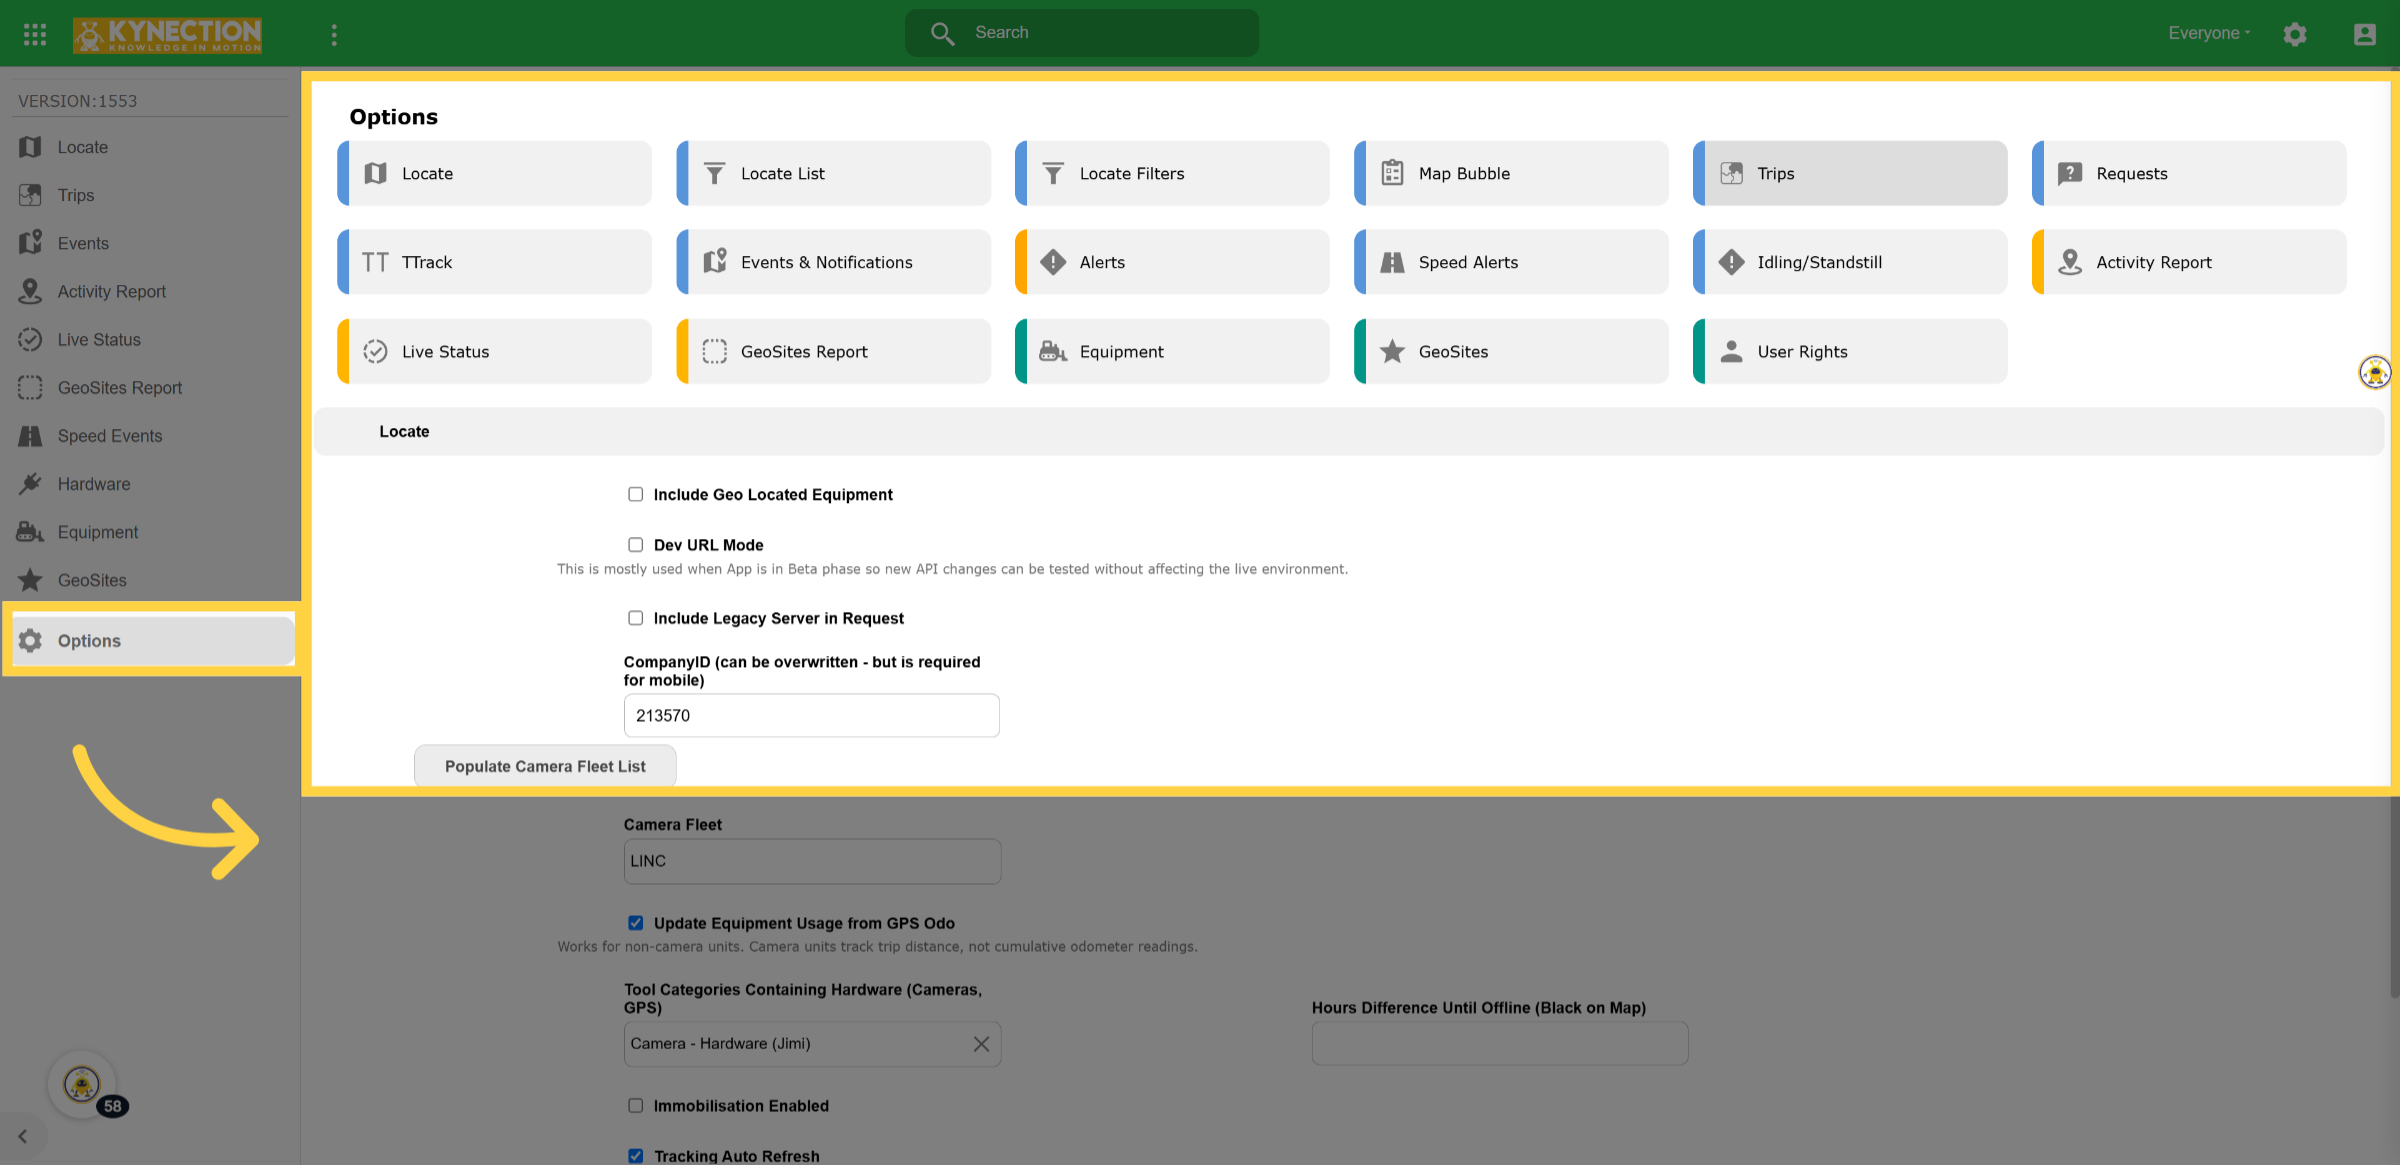
The options tab enables you to configure additional settings for each section.
Thanks for watching

